The following assets (on a weekly timeframe) registered an Overbought reading or traded more than 2.5 standard deviations above its rolling mean.
Extremes “above” the Mean (at least 2.5 standard deviations)
Cattle
Gasoline
USD/CNH (suggesting a weak Chinese Yuan)
USD/TRY (meaning a weak Turkish Lira)
Oslo’s equity index
the Nasdaq Transports index
And Instanbul’s BIST equity index
Overbought (RSI > 70)
Canadian and French 10 year government bond yields
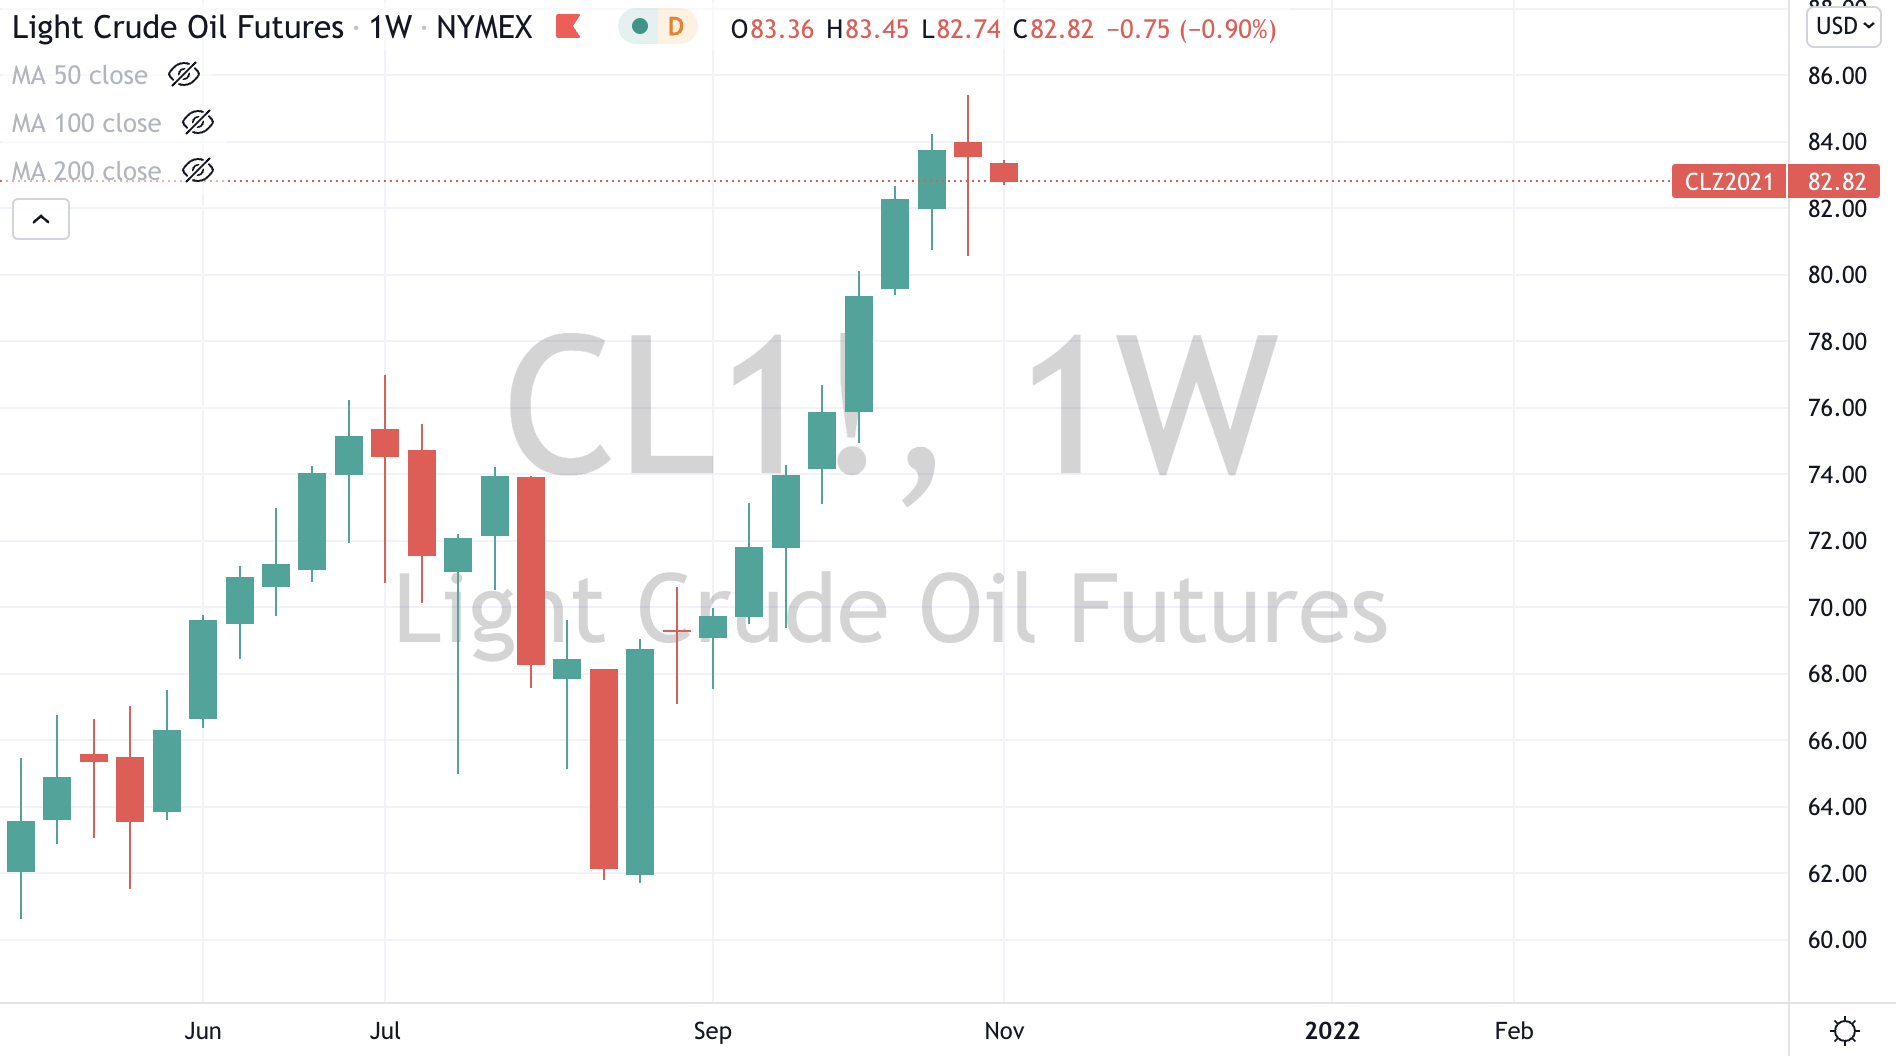
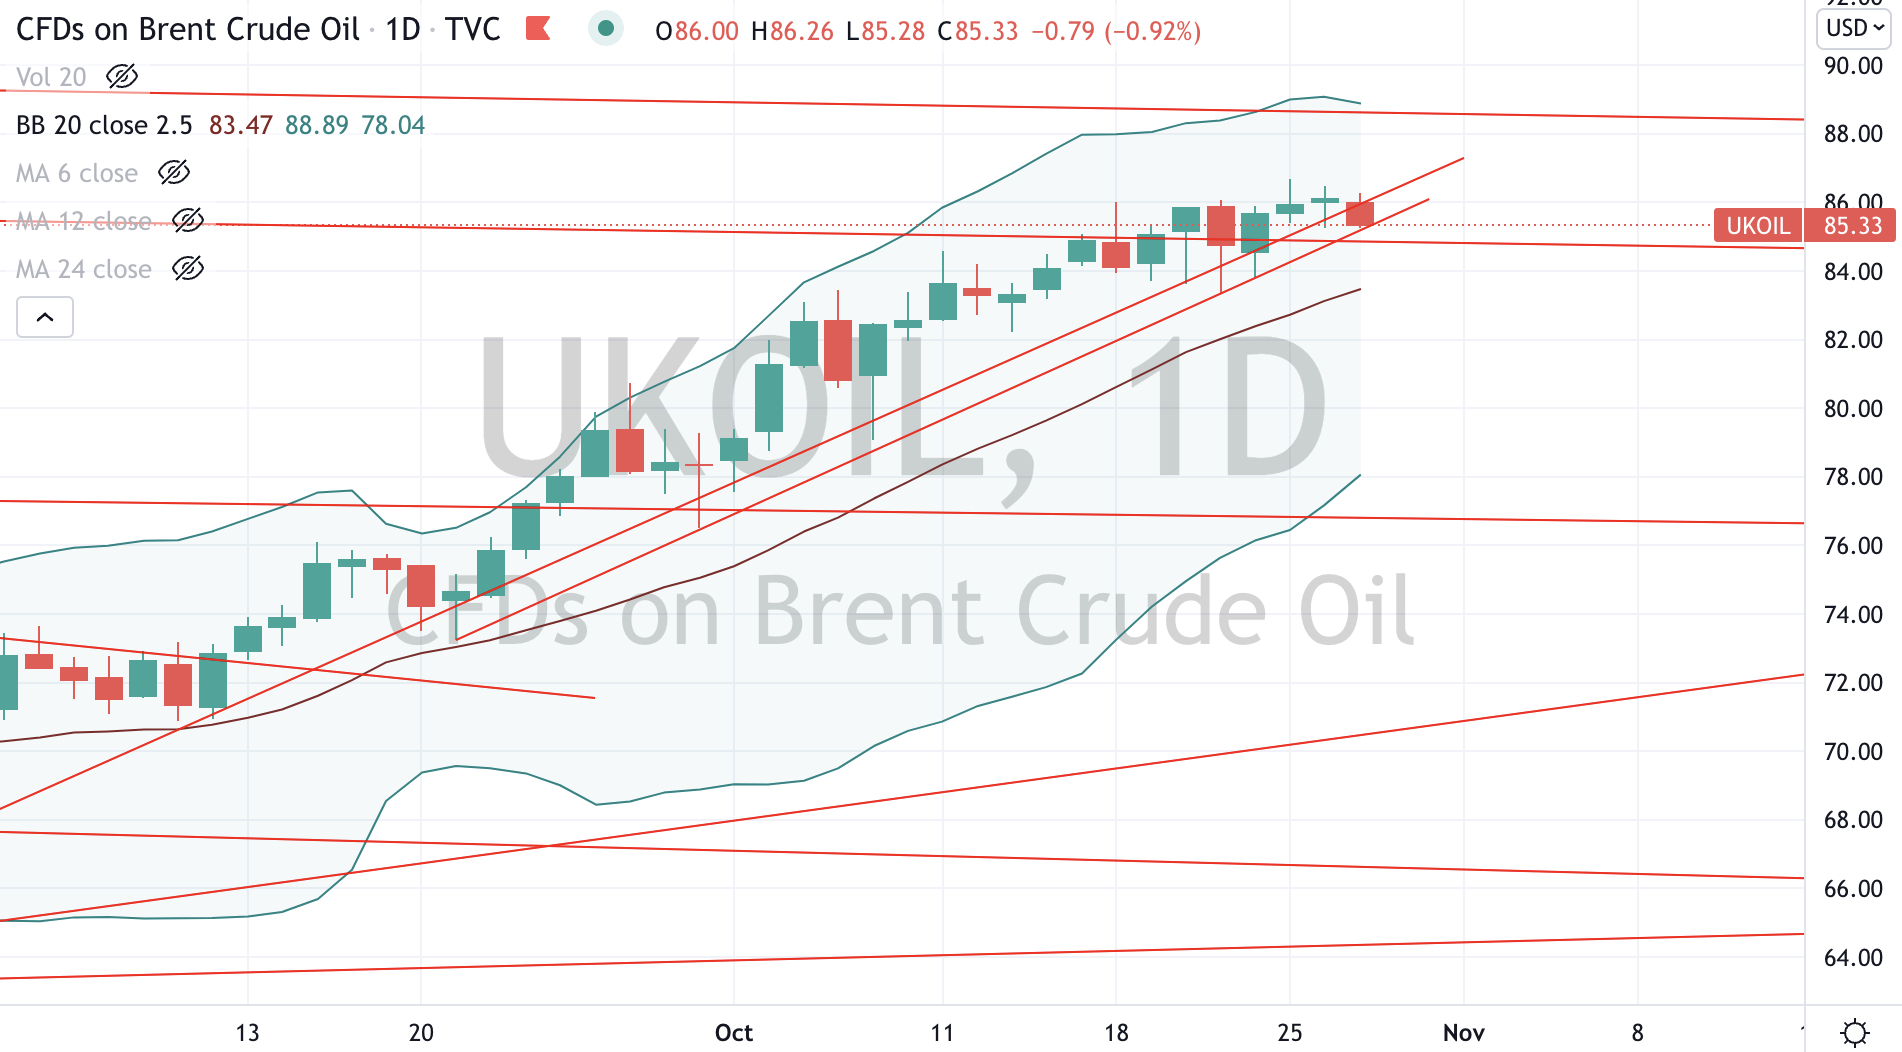
WTI Crude Oil
Gasoil
the JKM “Japan/Korea (LNG) Marker”
the CRB commodity indices
Australian coal
Amsterdam’s AEX equity index
Dow Jones Transports index
And the USD/JPY (which means a weak Yen and at it’s the weakest since early 2019, so sell USD and Buy JPY and use it to buy cheap Japanese equities).
The Overbought Quinella – Both Overbought and Traded at > 2.5 standard deviations above the weekly mean)
Australian 2, 5 & 10 year government bond yields
U.S. 2 year and 5 year govn’t bond yields
German 2 & 5 year bond yields
Greece 10’s (with a yield of 1.33%)
Italian, Korean and New Zealand 10’s
Urea
Assets (securities) which touched the other side of the extreme, being Oversold (where the RSI is < 30) or were at least 2.5 standard deviations below its mean are;
Extremes “below” the Mean (at least 2.5 standard deviations)
USD/CNH – for context, inverse to an overbought reading, suggesting a strong Chinese Yuan
EUR/AUD – telling us the Euro is weaker and we have a strong Australian Dollar, so sell your AUD and Buy EUR (there are some bargains amongst European equities)
And EUR/GBP
Oversold (RSI < 30)
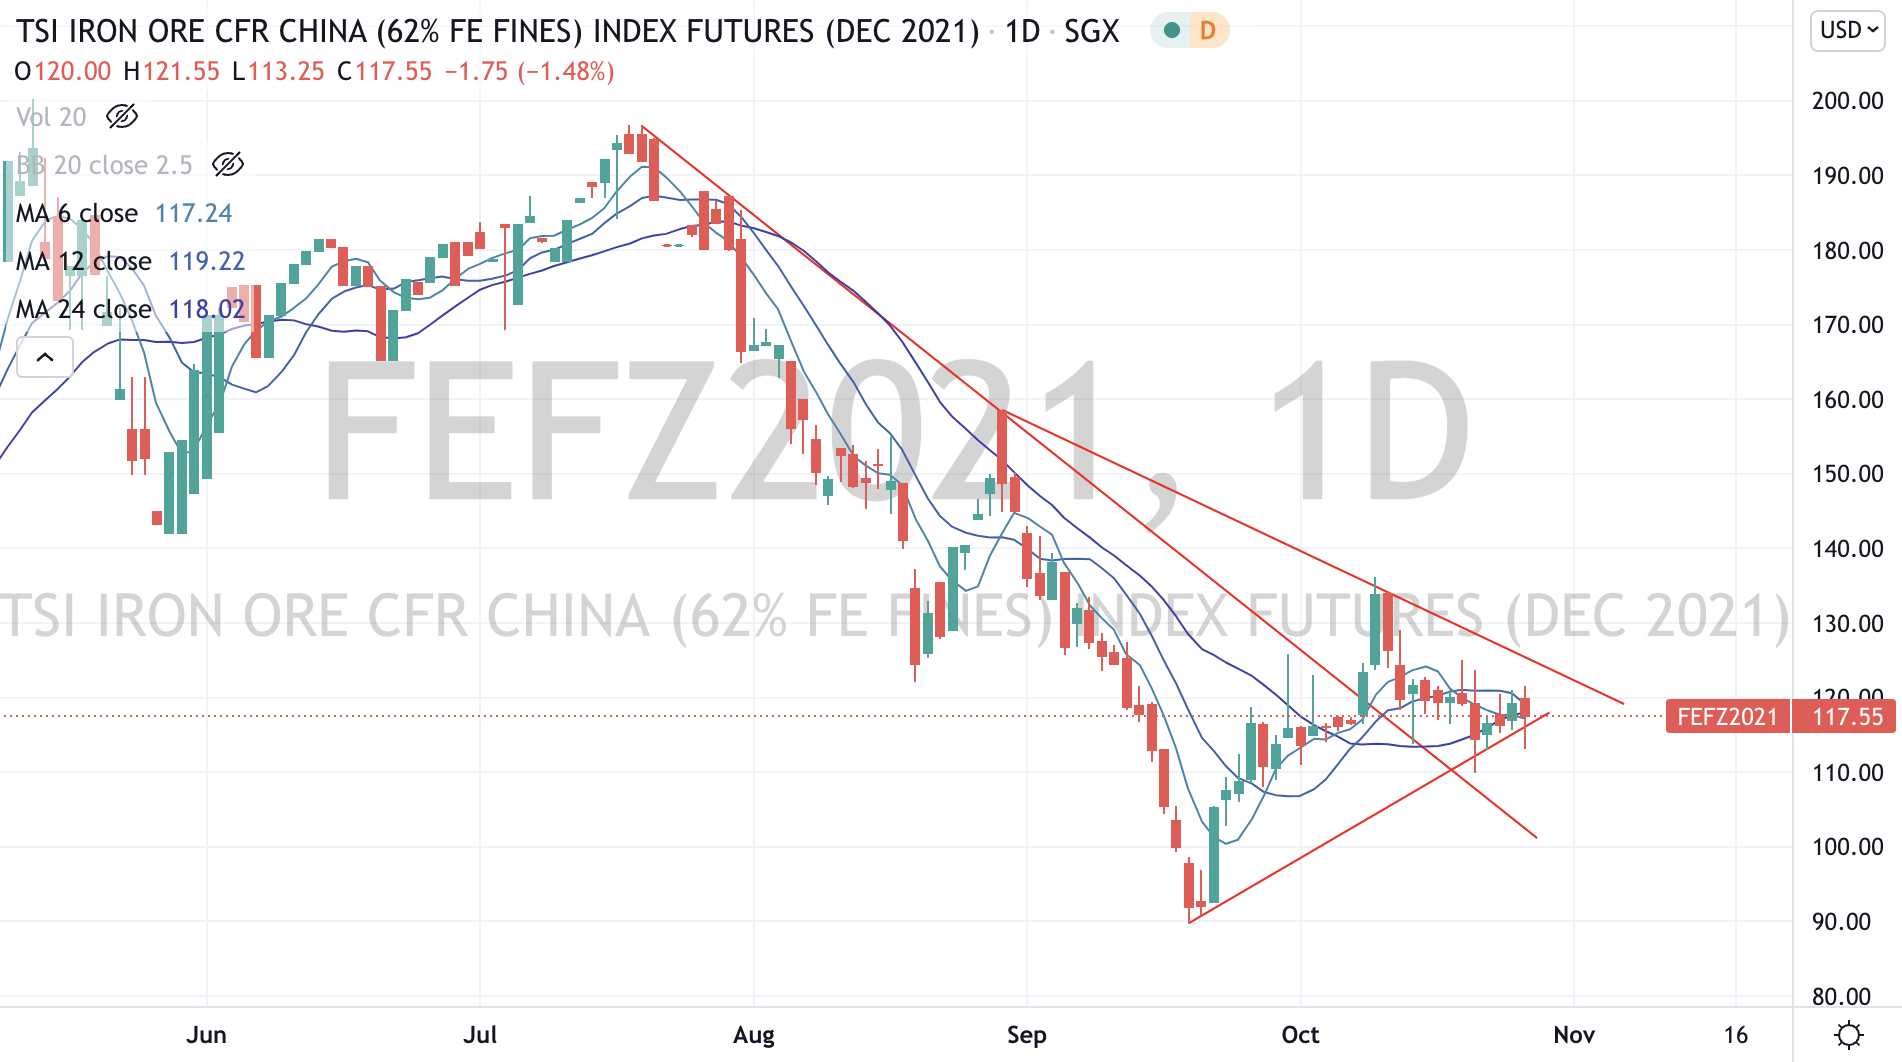
Iron Ore
Brazil’s Bovespa equity index
The Oversold Quinella – Both Overbought and Traded at > 2.5 standard deviations above the weekly mean.
None
Notes & Ideas:
The massive news this past week was bond yields rising dramatically. This means bonds were being sold and then its up to interpretation whether funds raised were being used elsewhere (seeking higher risk, perhaps equities) or whether the bond market is pricing in inflation and the pending higher cost of credit.
Take the moves in Australian government bond yields as an example; the 2 year bond yield moved rom 0.13% to 0.67%, while the 5’s went from 1.19% to 1.44% and the Aussie 10’s rose from 1.77% to 1.95% (seeing a high of 2.13%).
The latter is an interesting contrast to Greek 10 year bonds yielding 1.33%.
In other happenings, Hot Rolled Coiled Steel (HRC) broke its 56 consecutive weekly Overbought streak, as it declined 5.3% for the week.
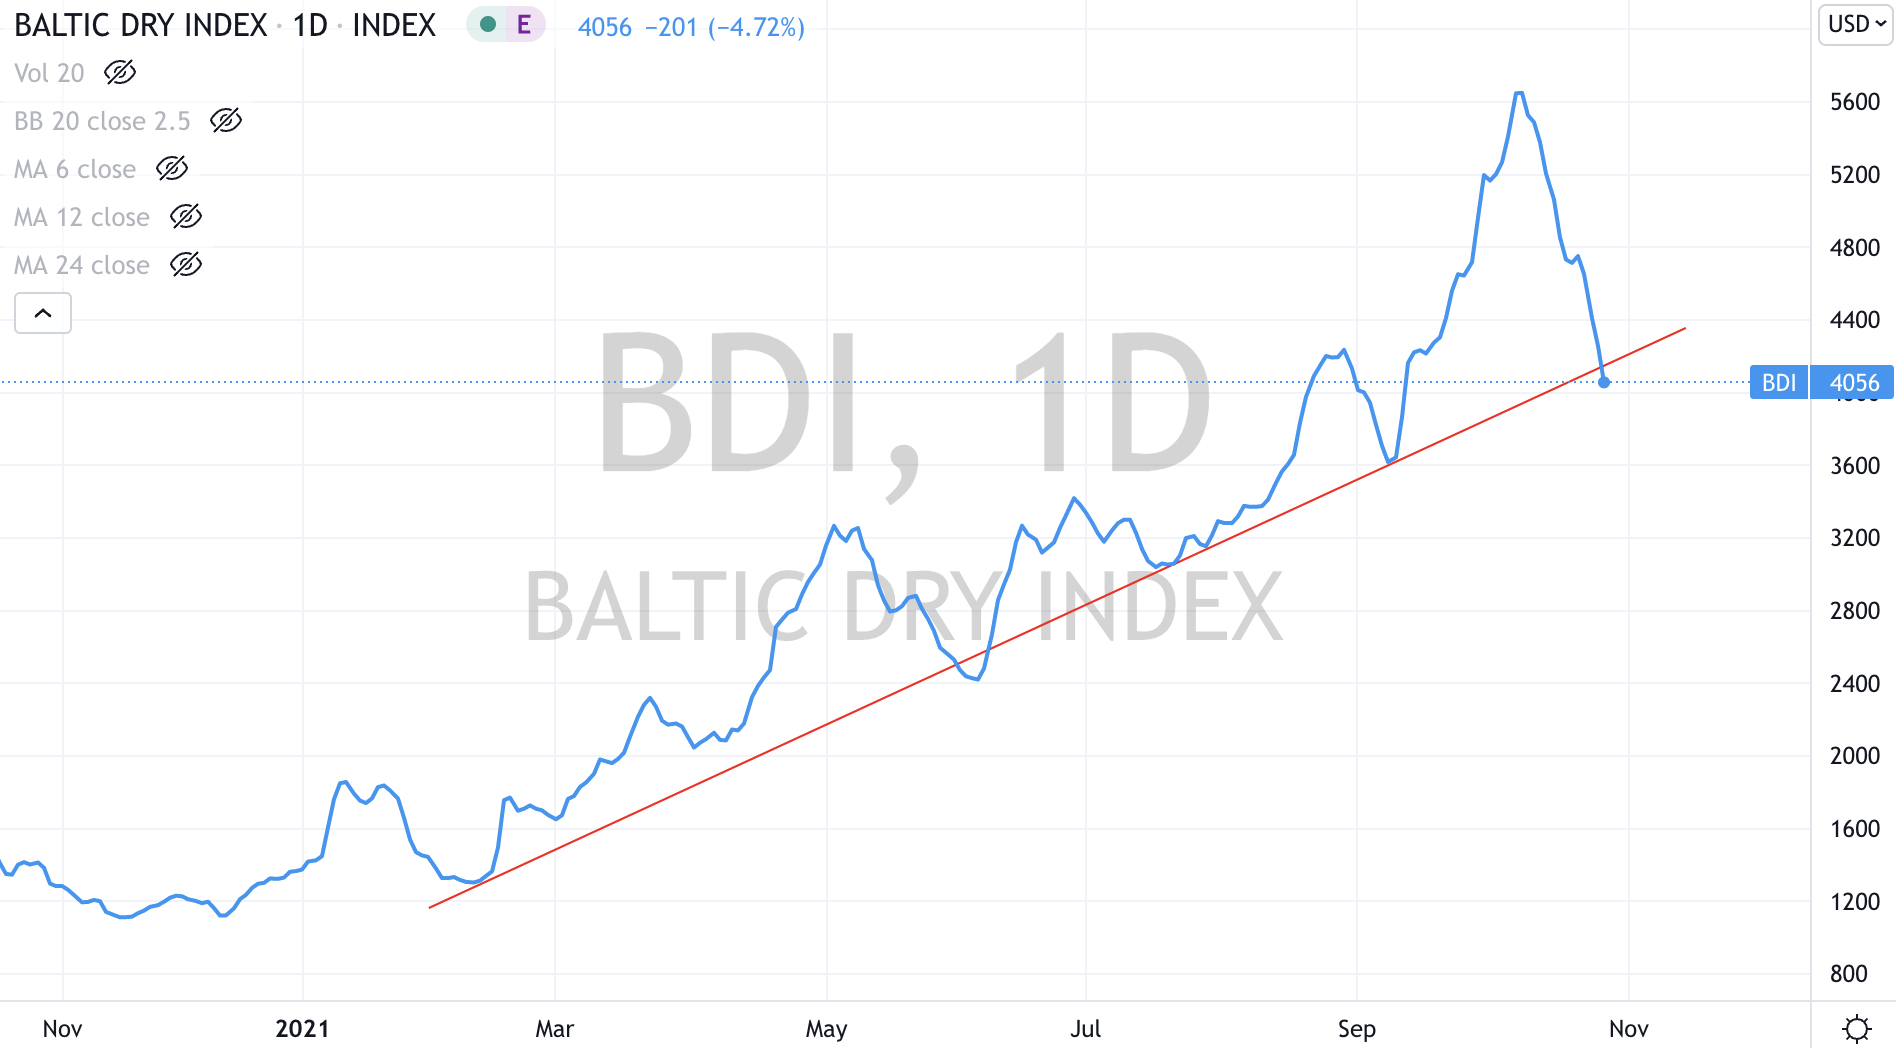
The Baltic Dry Index (the cost of shipping) fell 20%, adding to weeks of recent declines. The price is nearing a price target mentioned in a recent blog post.
Many energy commodities continue to decline (since their recent euphoric media emphasised peaks) with some exhibiting the mean reversion essence of this weekly post.
Some declines in gas and coal have been rapid. European (Rotterdam delivery) Coal fell 38% and Dutch (European) Gas prices slumped 26% in the week.
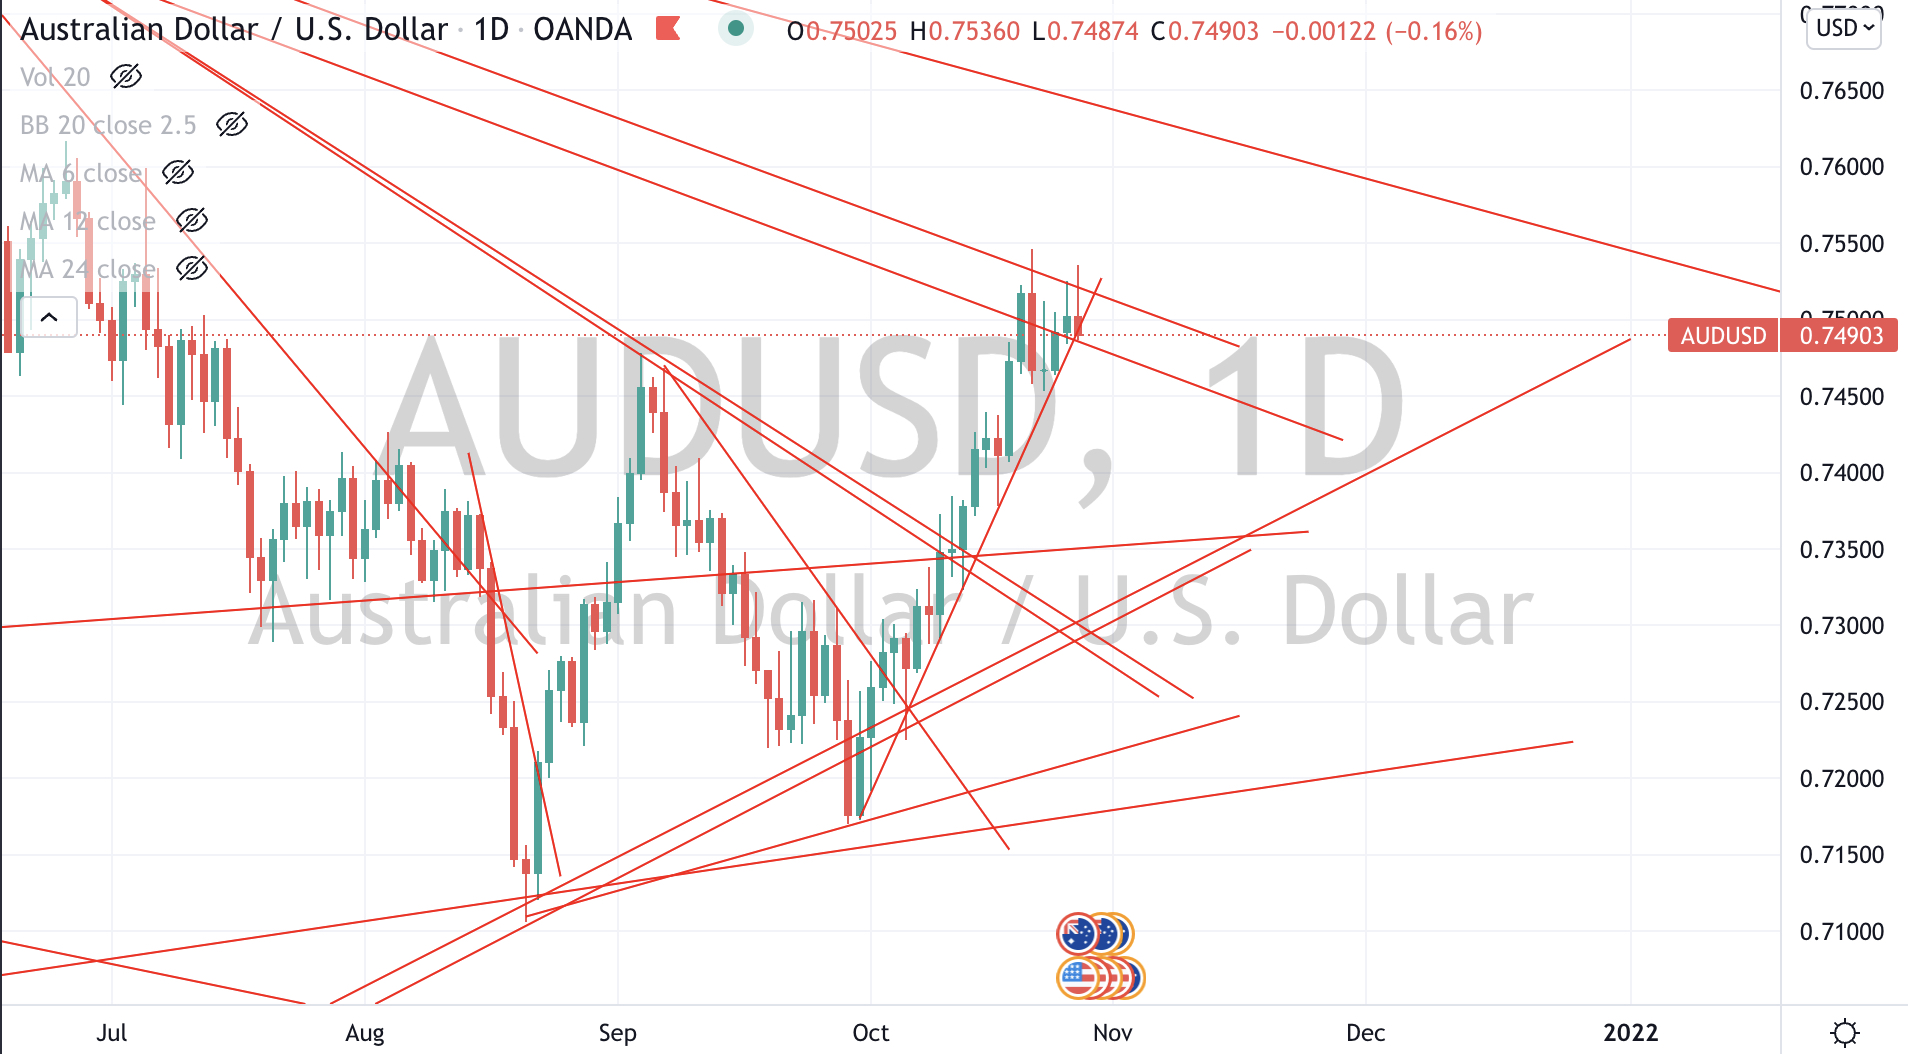
Watching the AUD/USD poke up against 0.7520 is also mesmerising. A break above this means 0.7645 is the next stop.
Other things to watch include the Spanish 10’s are nearing Overbought extremes, the Japanese 10’s are trending higher (currently at 0.11%) and suggesting “risk-on”, the US10 minus US2 year yields are suggesting an equities rally and Corn looks like entering a new medium term bullish trend.
The larger advancers over the past week comprised of Coffee 2.1%, Cattle 4.2%, Natural Gas 2.8%, Corn 5.6%, Wheat 2.2%, Urea 14%, the Nasdaq 3.2%, the Philly SOX 2.4%, the nasdaq Transports 2.6% and Istanbul’s BIST 2.9%.
The group of decliners included Aluminium (5.1%) adding to last week’s 8.3% rout, Baltic Dry Index (20%), Iron Ore (12.6%), Gasoil (2%), Copper (2.9%) further to last week’s 5% fall), HRC (5.3%) LKM LNG (9.8%), Lumber (15.1%), Orange Juice (3%), Australian Coal (4.7%), Dutch TTF Gas (25.7%), Platinum (3%), Gasoline (4.5%), Silver (2.1%), Brent Crude (2.4%), China Coal (11.4%), Rotterdam Coal (38%), Uranium (5.5%), KBW Banking index (2.8%), HSCEI (4.2%), Hang Seng index (2.9%), the Bovespa (2.6%) – its lowest since November ’20, Stockholm (2.5%), the Sensex (2.5%), Oslo (2.1%) and Helsinki (2.2%).
October 31, 2021
by Rob Zdravevski
rob@karriasset.com.au