Rigs in operation continues to increase
December 11, 2021 Leave a comment
The amount of rigs in operation (globally) now back to levels seen 19 months ago.
African and U.S. locales lead the month over month percentage increase.
Trying to hear what's not being said
December 11, 2021 Leave a comment
The amount of rigs in operation (globally) now back to levels seen 19 months ago.
African and U.S. locales lead the month over month percentage increase.
December 7, 2021 Leave a comment
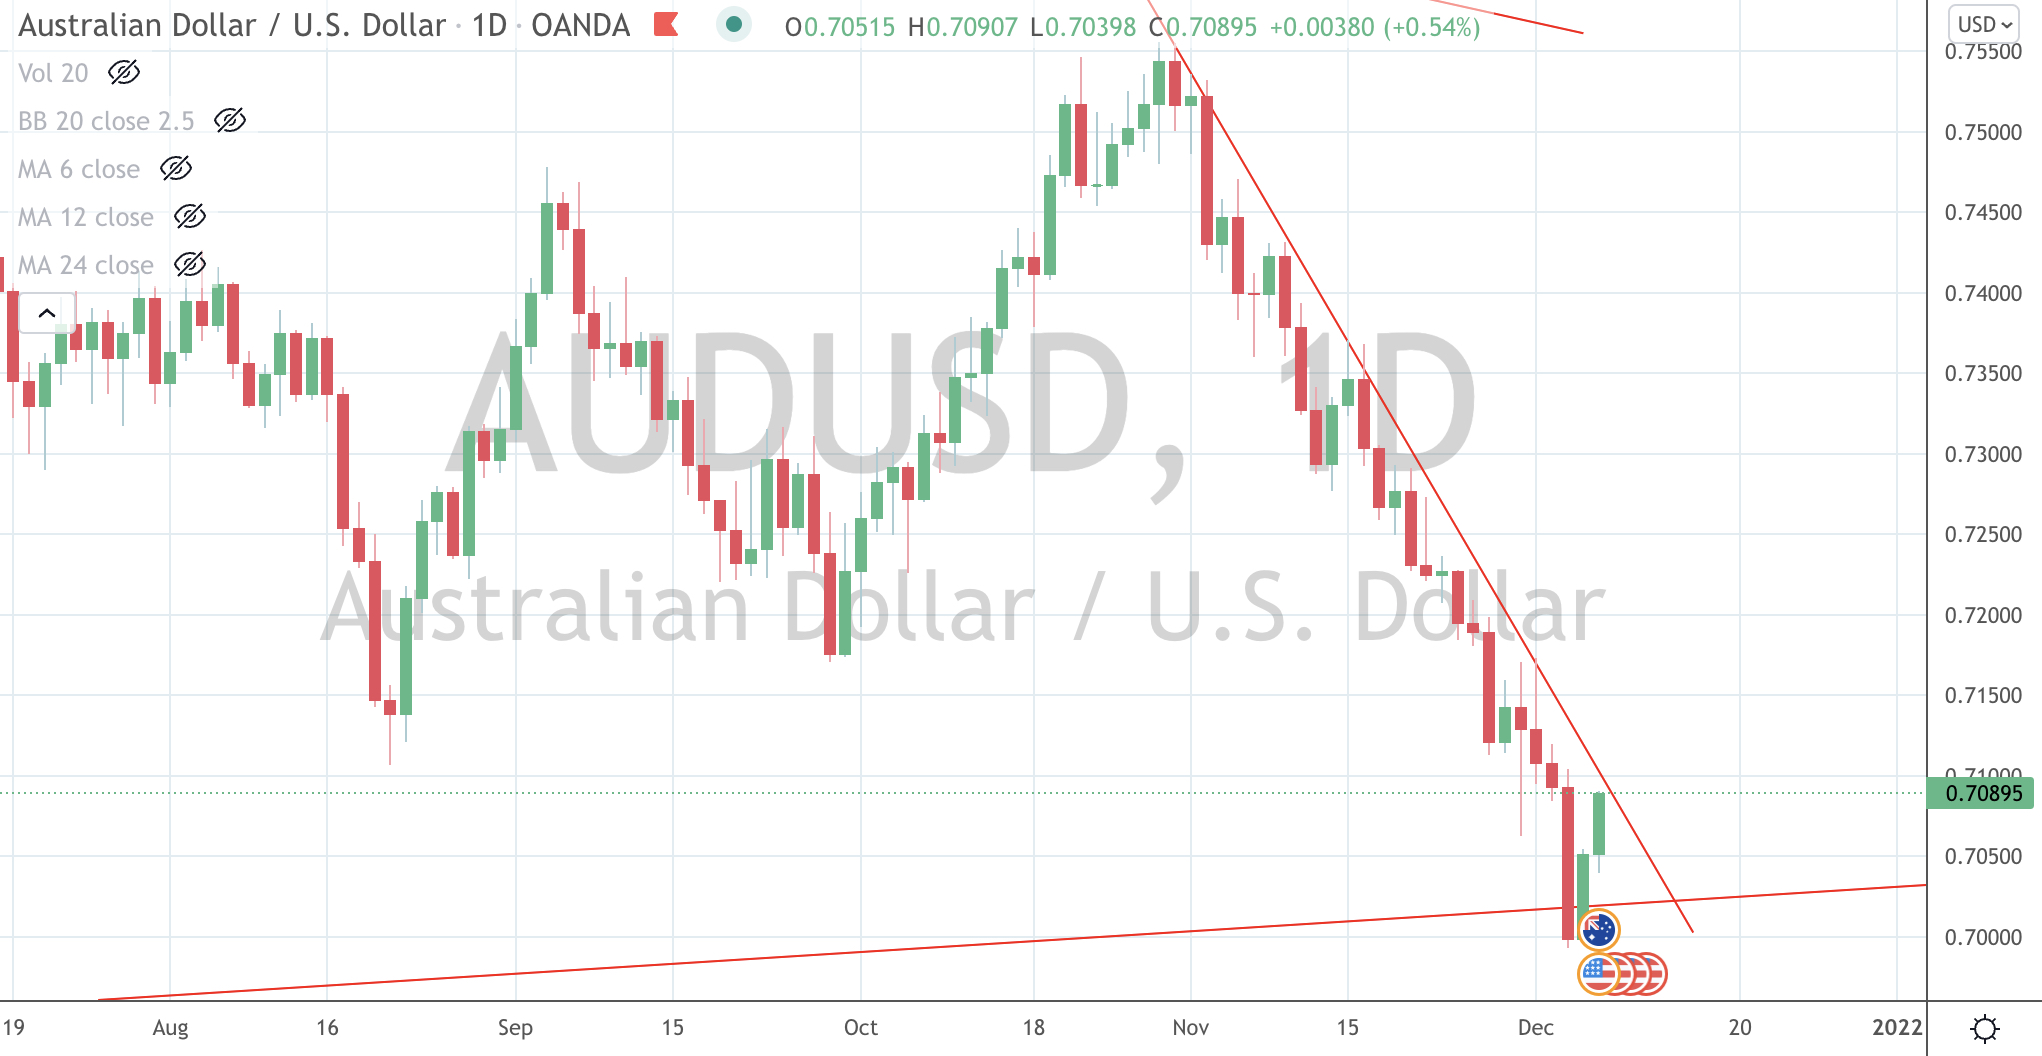
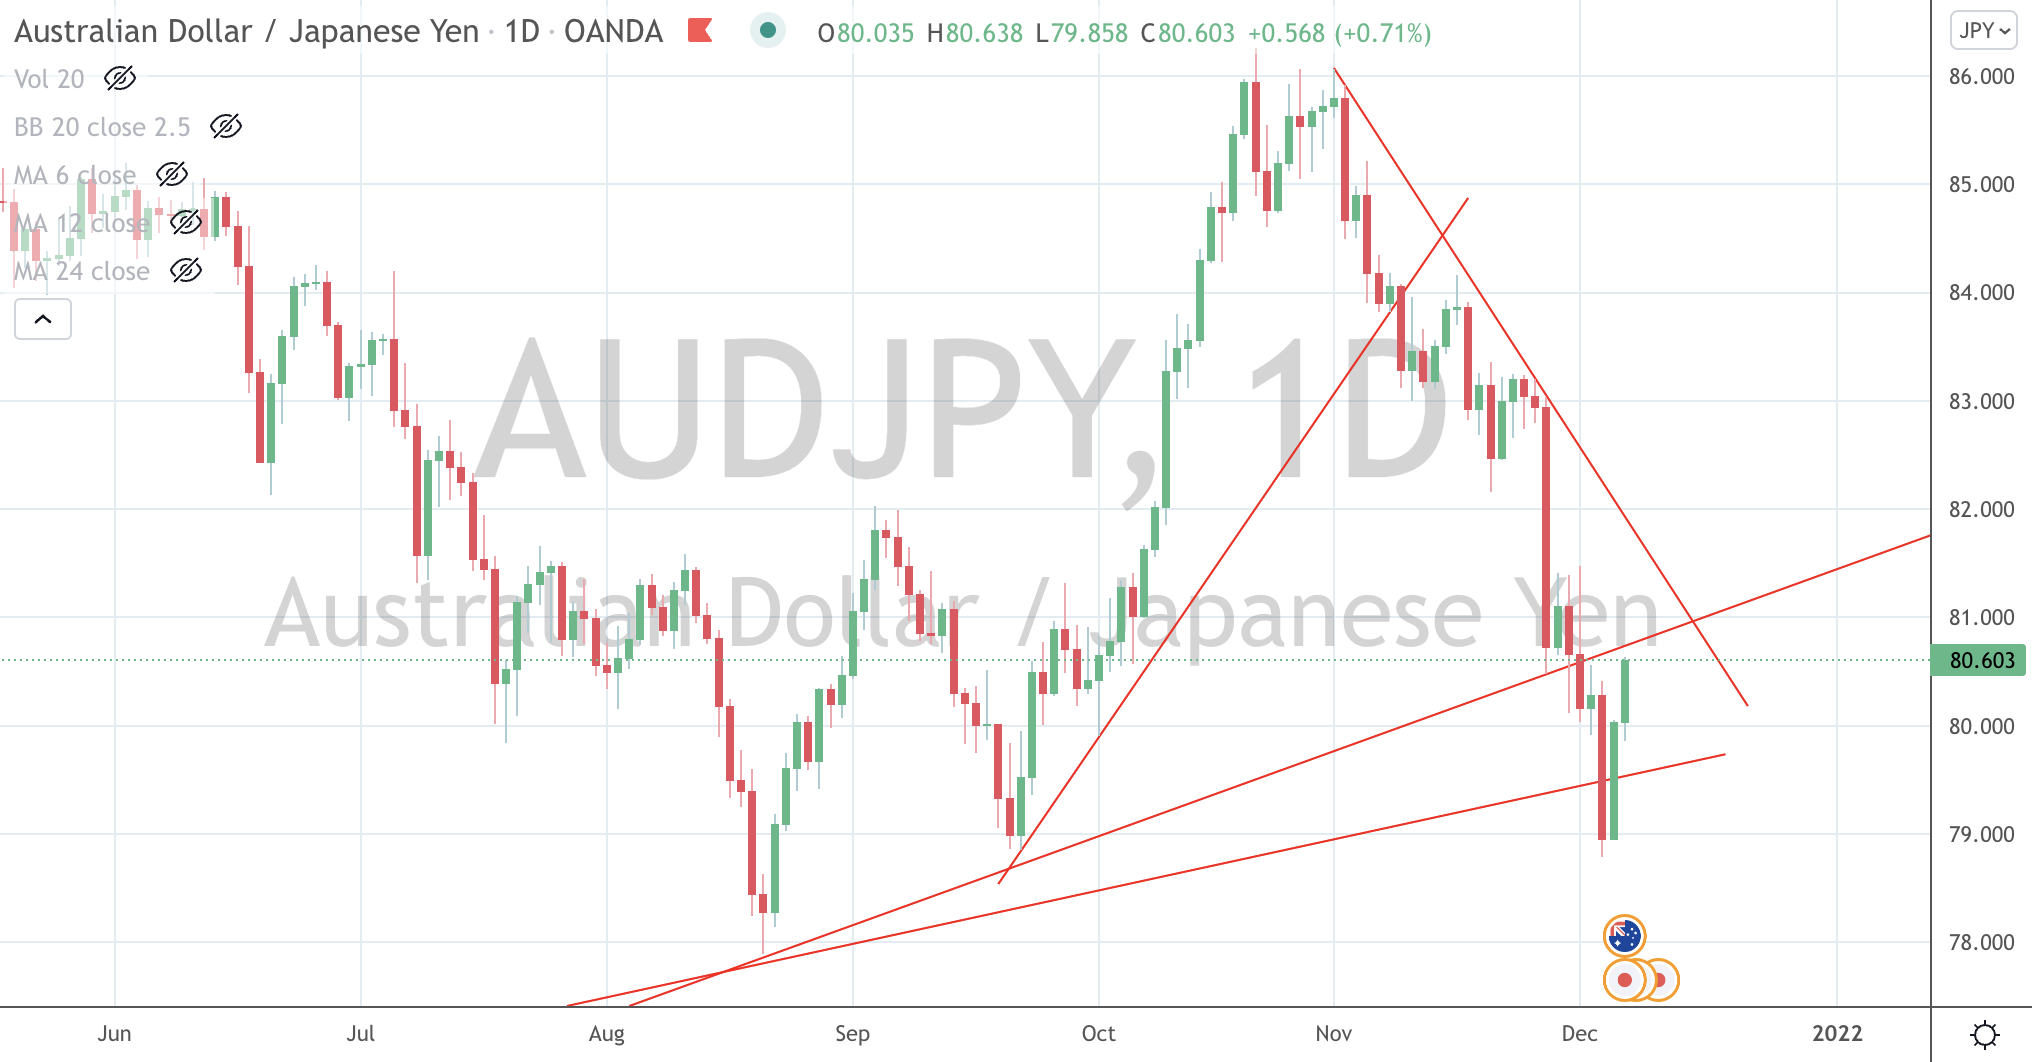
Into the start of Tuesday’s European and U.S. trading day, I’m watching the price action in the AUDUSD and AUDJPY.
A break above its near resistance line aides the case for higher equity prices.
A failure to break these levels increases probability of equity re-testing recent lows.
#doubledip
December 7, 2021
by Rob Zdravevski
rob@karriasset.com.au
December 6, 2021 Leave a comment
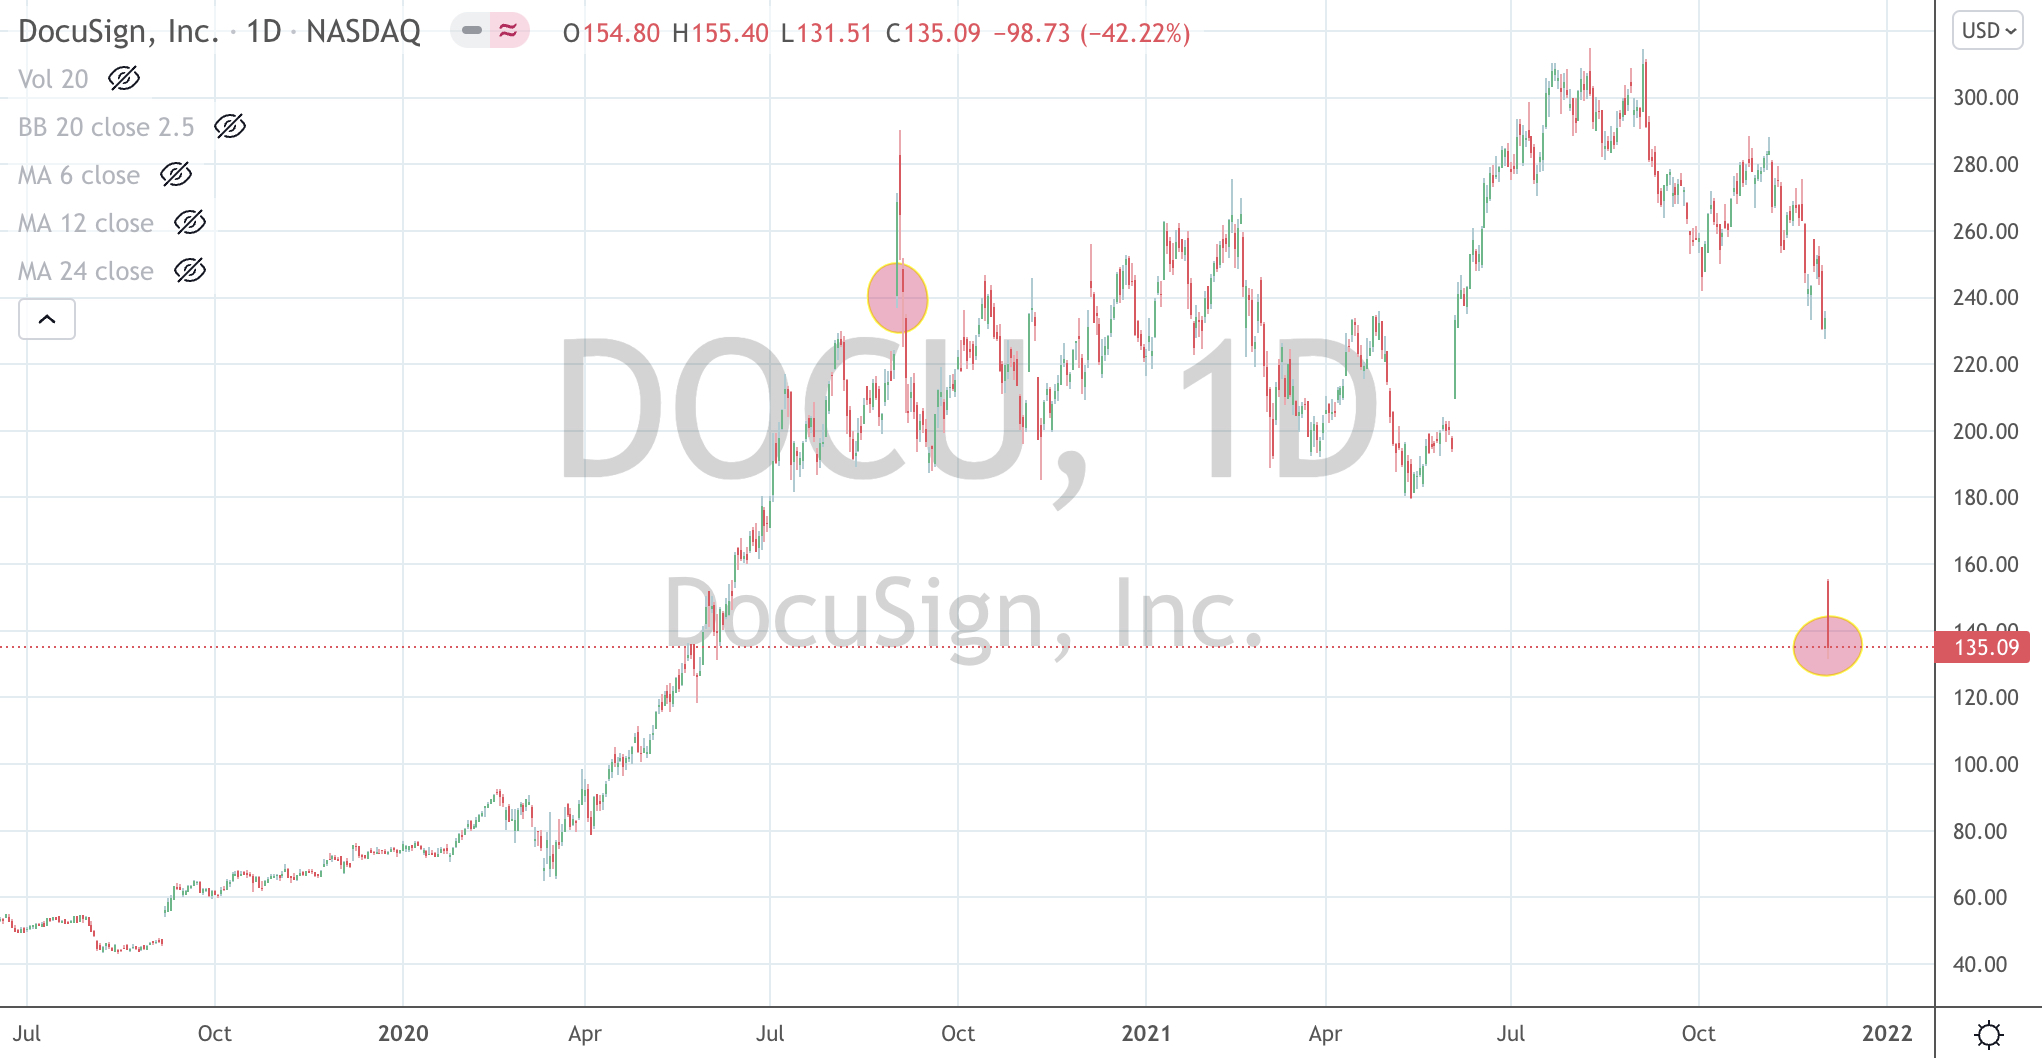
On Friday, shares in U.S. listed Docusign (DOCU) slumped 42% to close at $135 per share.
This prompts a revisitation of the company’s prospects.
Client portfolio’s have owned that stock before. Happily, those positions were sold at $240 in September 2020 (almost 15 months ago).
I have made reference to these selling decisions (and other stocks) in this post, dated March 19, 2021.
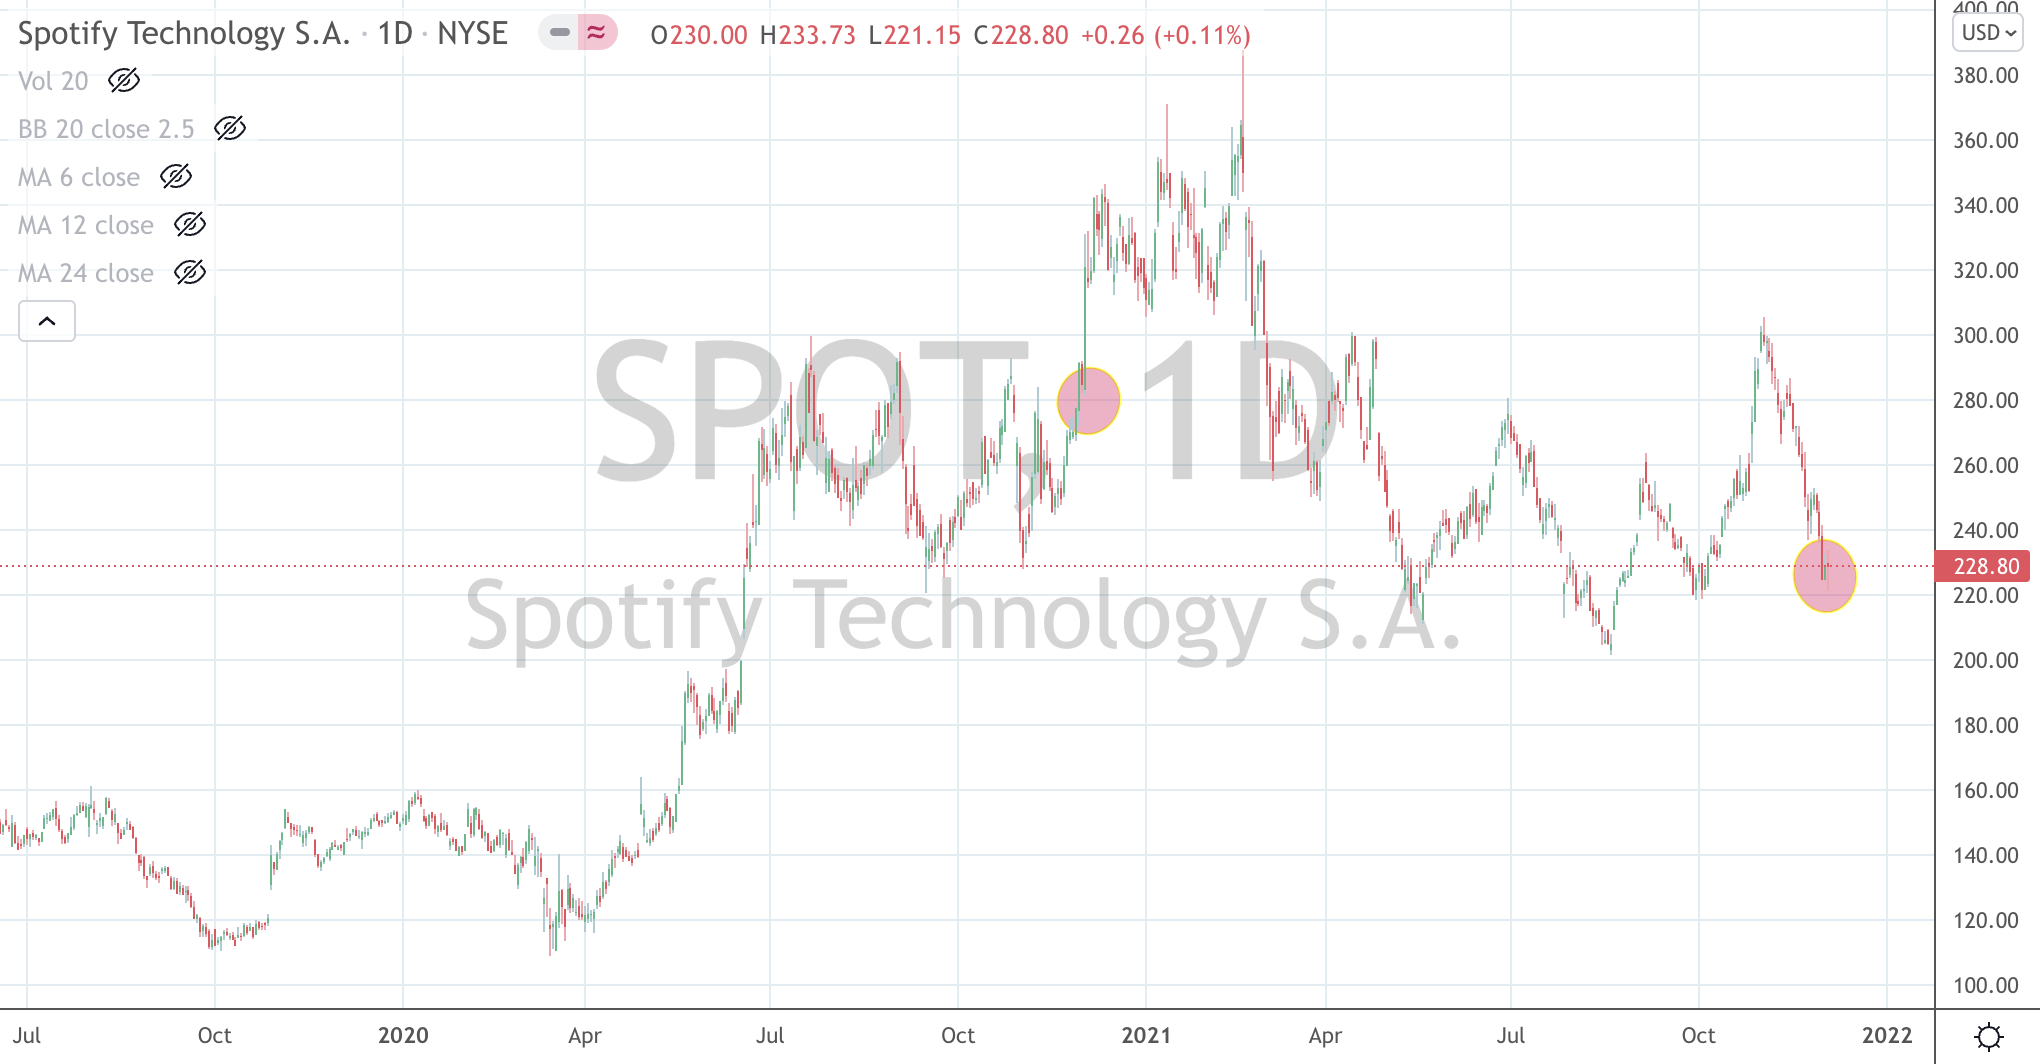
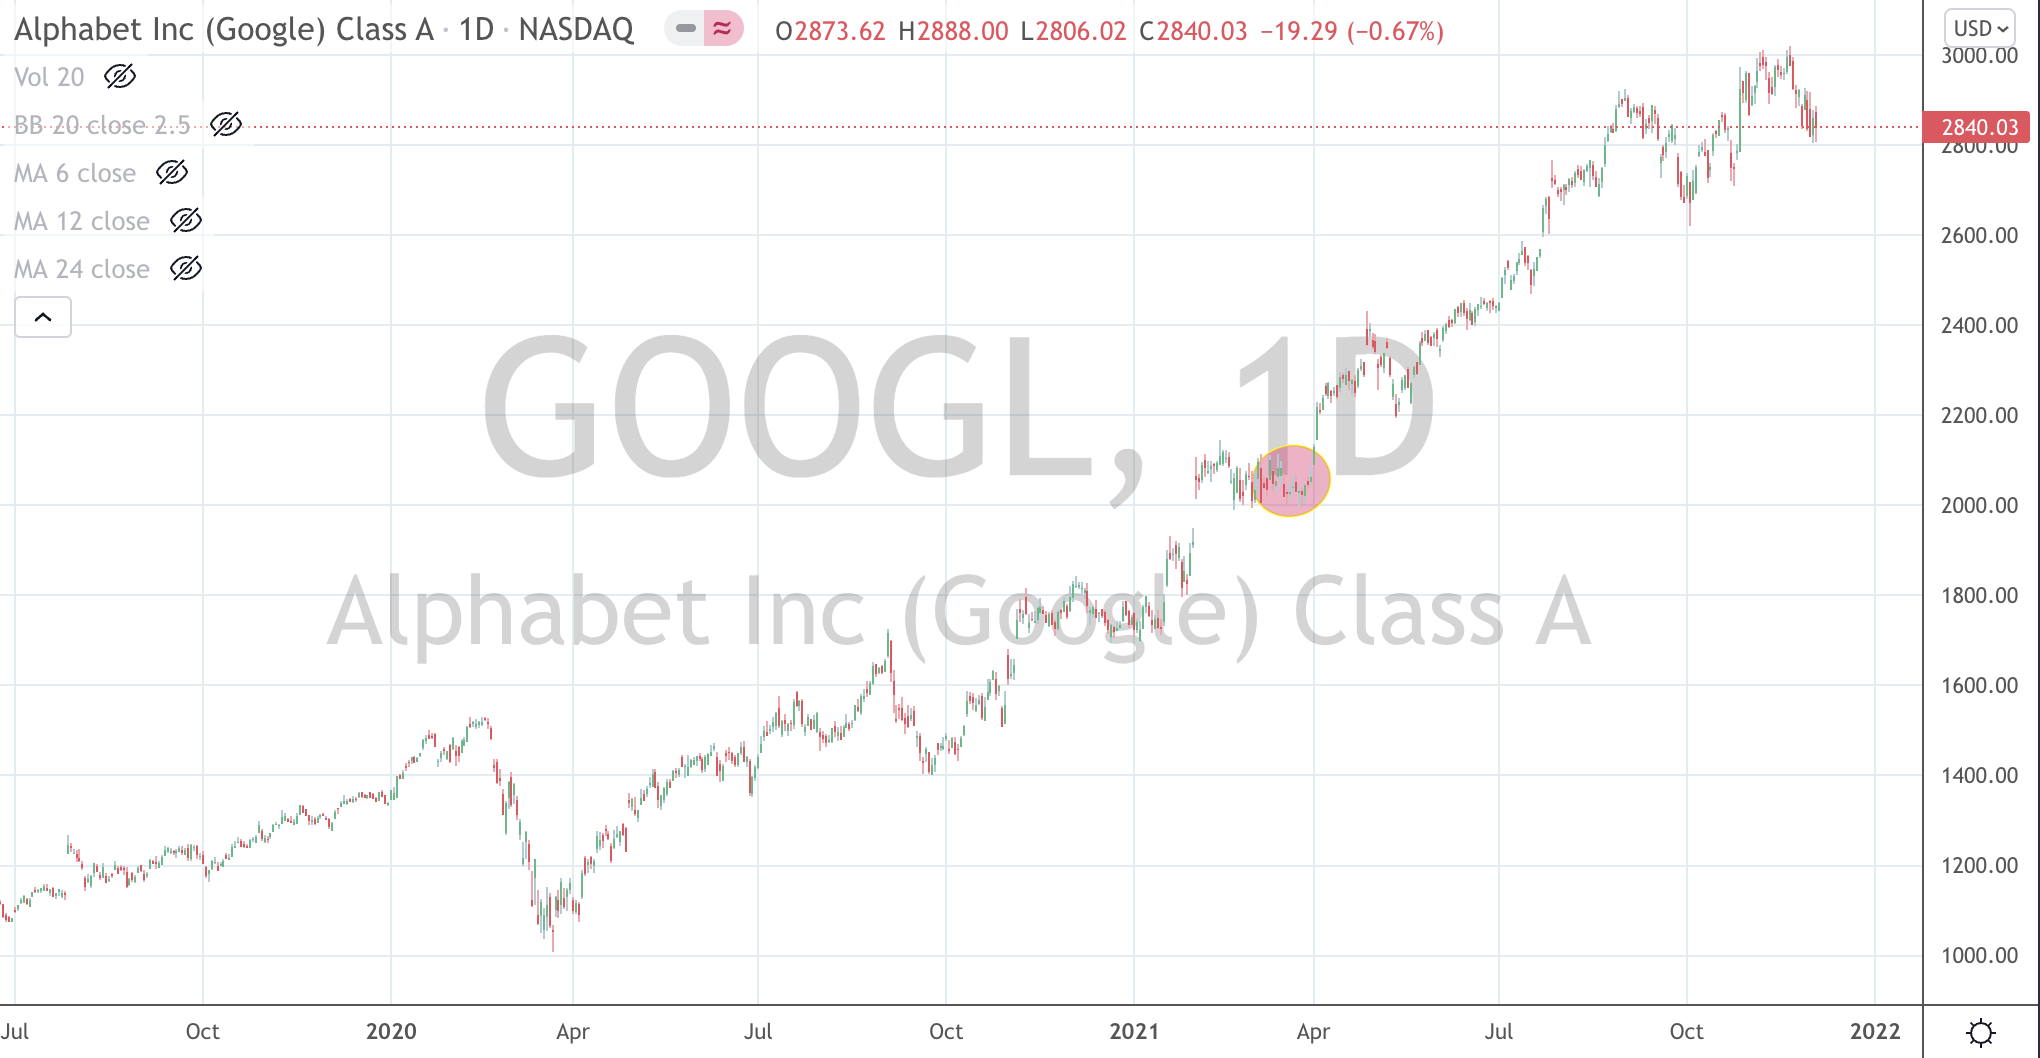
In a continuing post mortem of investment decisions, the charts below highlight where I’ve sold particular stocks and compare it to their latest closing prices.
While I may be critical for ‘selling too early’, I am sanguine in sticking to my discipline and reasoning behind those selling decisions. It’s not a case of vindication.
Sometimes the decision to sell can simply mean that I can’t convince myself to buy more of a stock at their higher, improved prices or more to the point, I’m not comfortable taking on current or more risk by continuing to hold it. This is when you hear the term, ‘preservation of capital’ being used.
I guess that this also falls into the category of ‘catching the fat part of the trade’.
You could also say that there does come a time to sell. The ‘set and forget’ trade is fraught with danger as the ‘forget’ portion possibly suggests that you don’t need to monitor or check your investments.
Incidentally, the linked post mentioned Alphabet (Google) stock as a position that I will not be selling at that time.
Its chart is also included below. I am still holding GOOGL.
December 6, 2021
by Rob Zdravevski
rob@karriasset.com.au


December 5, 2021 Leave a comment
The following assets (on a weekly timeframe) registered an Overbought reading or traded more than 2.5 standard deviations above its rolling mean.
Extremes “above” the Mean (at least 2.5 standard deviations)
Lumber
Overbought (RSI > 70)
U.S. 2 year bond yields
Turkish 10 year bond yields (now yielding 20.5%)
the JKM “Japan/Korea (LNG) Marker”
Coffee
Cattle
Tin
Urea
and the U.S. Dollar (DXY) Index
The Overbought Quinella – Both Overbought and Traded at > 2.5 standard deviations above the weekly mean)
None
Assets (securities) which touched the other side of the extreme, being Oversold (where the RSI is < 30) or were at least 2.5 standard deviations below its mean are;
Extremes “below” the Mean (at least 2.5 standard deviations)
Hot Rolled Coil Steel (HRC) – now 17% below its recent high
Gasoline
AUD/USD (suggesting a weaker Aussie versus the USD)
GBP/USD
SEK/USD
The Hang Seng equity index
And Spain’s IBEX equity index
Oversold (RSI < 30)
None
The Oversold Quinella – Both Overbought and Traded at > 2.5 standard deviations above the weekly mean.
The difference between the U.S. 10 year bond yield minus the U.S. 2 year bond yield (which is at its lowest since July 9, 2018)
TRY/USD – the Turkish Lira is historically weak
Notes & Ideas:
The difference from last week’s edition is that Chinese 10 year bond yields and the Nasdaq 100 are no longer Overbought and Iron Ore and the EUR/USD aren’t Oversold anymore. The Euro is still in my buying range.
It’s worthy to note that last week I commented about the outside bearish reversal for U.S. equity indices. Prior to that, these indices have also appeared amongst the overnight extremes over the past month.
Although picking the moment to sell is a seperate analysis and discipline, this weekly note is actually designed to help you understand when NOT to Buy (in the recent case of U.S. equity indices) at the recent extremes they were exhibiting.
The S&P 500 only fell 1.2% for the week and is 4.3% below its recent high. The Nasdaq 100 has fallen 6.3% from its high. I’m looking for it to hold 15,020. More on this index in a seperate post. As is often the case, smaller caps tend to cop the initial brunt of a trend reversal. The Russell 2000 has declined 12% in the past 4 weeks.
The largest mover in my macro world was the 25% weekly decline in the Henry Hub (U.S.) Natural Gas prices. They are now down 36% from their recent high.
Amongst other commodities, Rotterdam Coal is 56% below its recent peak, Aluminium has fallen 20%, Soybeans is 22% below its high as is WTI Crude Oil, which happens to be recording its 6th consecutive ‘down’ week and it back at the same price seen in March 2021.
But I remind readers, that we only hear the ‘noisy’ financial media reporting the hoopla when these prices were rising. Mean reversion is a real thing, especially following parabolic rising moves.
Similar to the case when the Baltic Dry Index fell 57% through October and November. Incidentally, this decline coincided with an equally savage fall in the price of Iron Ore. When you marry these two occurrences, Iron Ore companies suddenly offset the decline in their commodity price with the savings made in shipping it.
In other news, the U.S. 10’s are currently on a 1.34% support line.
In early and mid October 2021, Turkey was in the midst of political weight being thrown against central bank policymaking. That is when I wrote a note suggesting Buying Turkish Banks. Since then Istanbul’s BIST equity index has featured in the list of advancers within this weekly publication. In the past week, the BIST rose 8.5% and this adds up to a 32% for this index within 7 weeks. Simply extraordinary.
This may seen perverse but it highlights a strategy of buying in the wake of what seems to be bad news. Over the past 7 weeks, shares in Akbank have risen 35%, Garanti advanced 33%, isBank climbed 36% and Yapi Kredi soared 48%.
It’s now prudent to sell those bank stocks.
The larger advancers over the past week comprised of the Baltic Dry Index 14.6%, (up 23% in 2 weeks), Cocoa 3%, Gasoil 2.4%, Lumber 18.3%, China Coal 10.5%, Bovespa 2.8%, MOEX 2.6%, TAIEX 1.9% and Istanbul’s BIST equity index rose 8.5%.
The group of decliners included Bloomberg Commodity Index (4.1%), WTI Crude (2.8%), JKM (2%), Tin (2.1%), Natural Gas (24.6%), Orange Juice (1.8%), Platinum (2.9%), Sugar (3.1%), Uranium (2.9%), Australian Coal (14.3%), Rotterdam Coal (15.6%), Wheat (4.4%), Brent Crude Oil (4.1%), Silver (2.7%), CRB Index (2.7%), KBW Banking Index (3.2%), IBEX (1.9%), S&P 400 Midcap (2.7%), Nasdaq (2%)< Nikkei (2.5%), Copenhagen 25 index (3.7%), Russell 200 (3.9%), Singapore’s Strait Times (2%) and Australia’s ASX 200 only fell 0.5% for the week.
December 5, 2021
by Rob Zdravevski
rob@karriasset.com.au
December 2, 2021 Leave a comment
This is where we are on a weekly basis in the U.S. 10 year bond yield.
Range bound, in no man’s land and oscillating between 1.75% and 1.15% and a reasonable trading range at that.
It has also been a trap lately. At the upper end, many are going long cyclicals and financials only to be whipsawed when the 10’s trade to the lower end, which is when many go long in technology.
Let’s watch which way its break into this triangle.
My bet is that the yield goes lower a little bit more and sends the S&P 500 to 4,440 or 4,360 (which is 1.6% – 3.4% below today’s close) and set us up for a new equities advance.
Irrespective of this little nuance prediction, today, there are a host of quality businesses whose stock prices have received a drubbing.
December 2, 2021
by Rob Zdravevski
rob@karriasset.com.au

December 2, 2021 Leave a comment
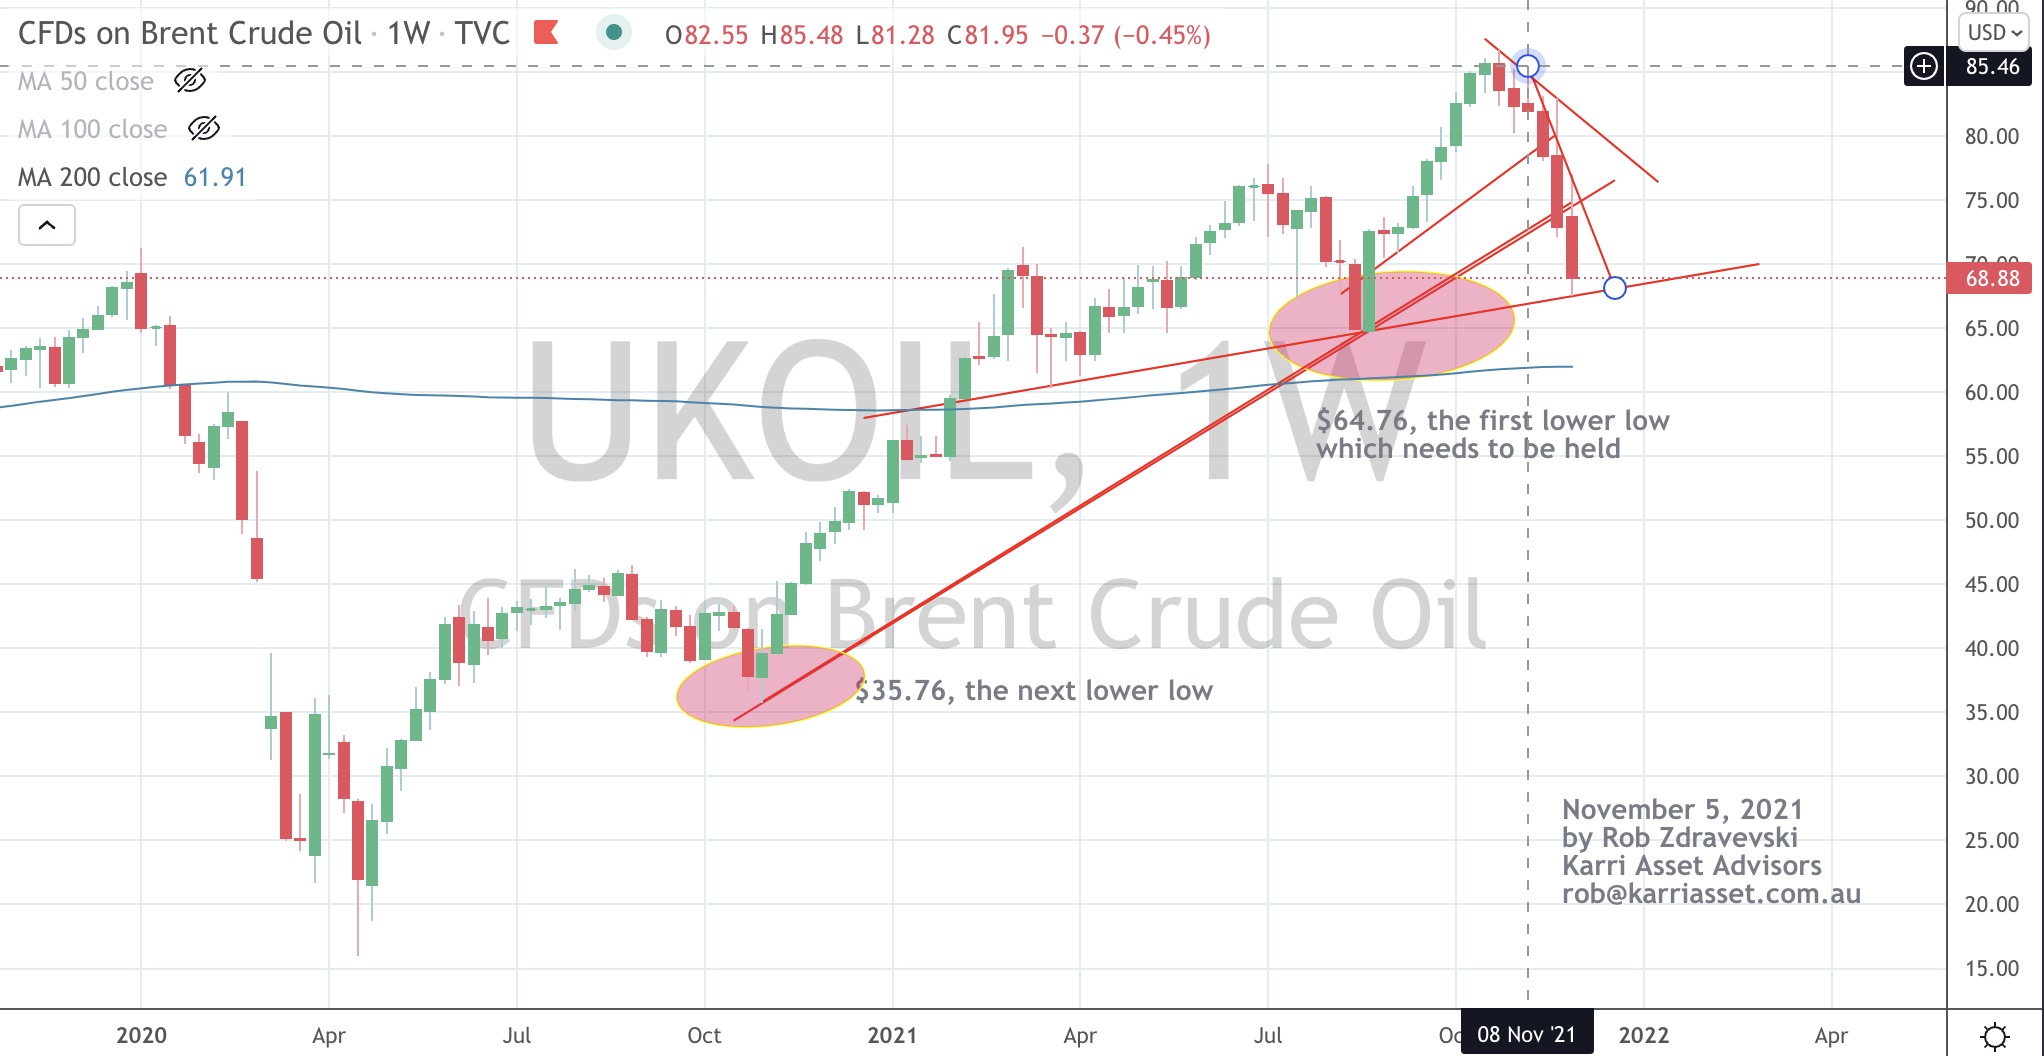
I’m keenly watching Crude Oil prices today.
The chart below shows the support level Brent is at.
Those trendlines were drawn up on November 5th, when Brent was $85.
Note, the other commentary as well. Amongst monitoring other indicators, the price action that I am watching is whether or not we see new ‘lower lows’.
Copper is testing a $4.20 support and the AUDUSD is flirting whether it holds 0.7100.
December 2, 2021
by Rob Zdravevski
rob@karriasset.com.au
November 30, 2021 Leave a comment
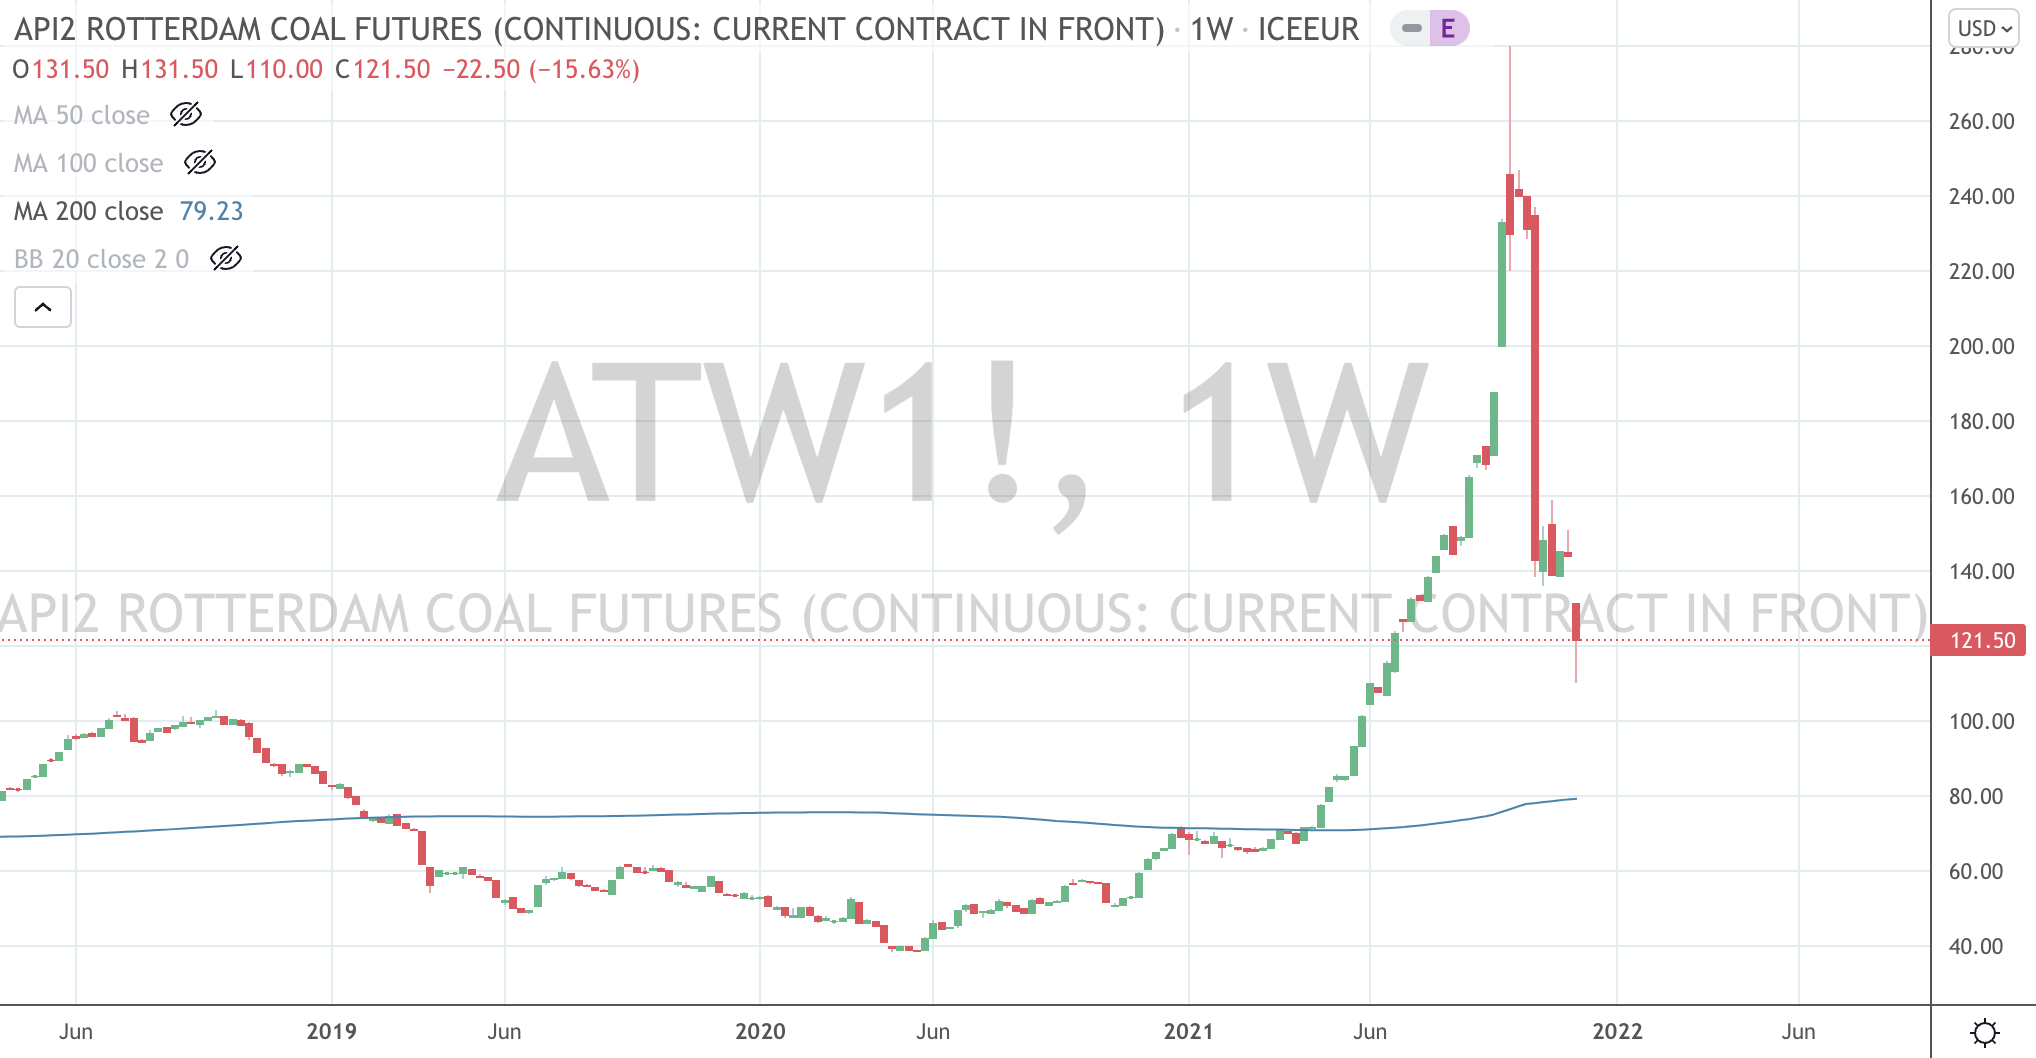
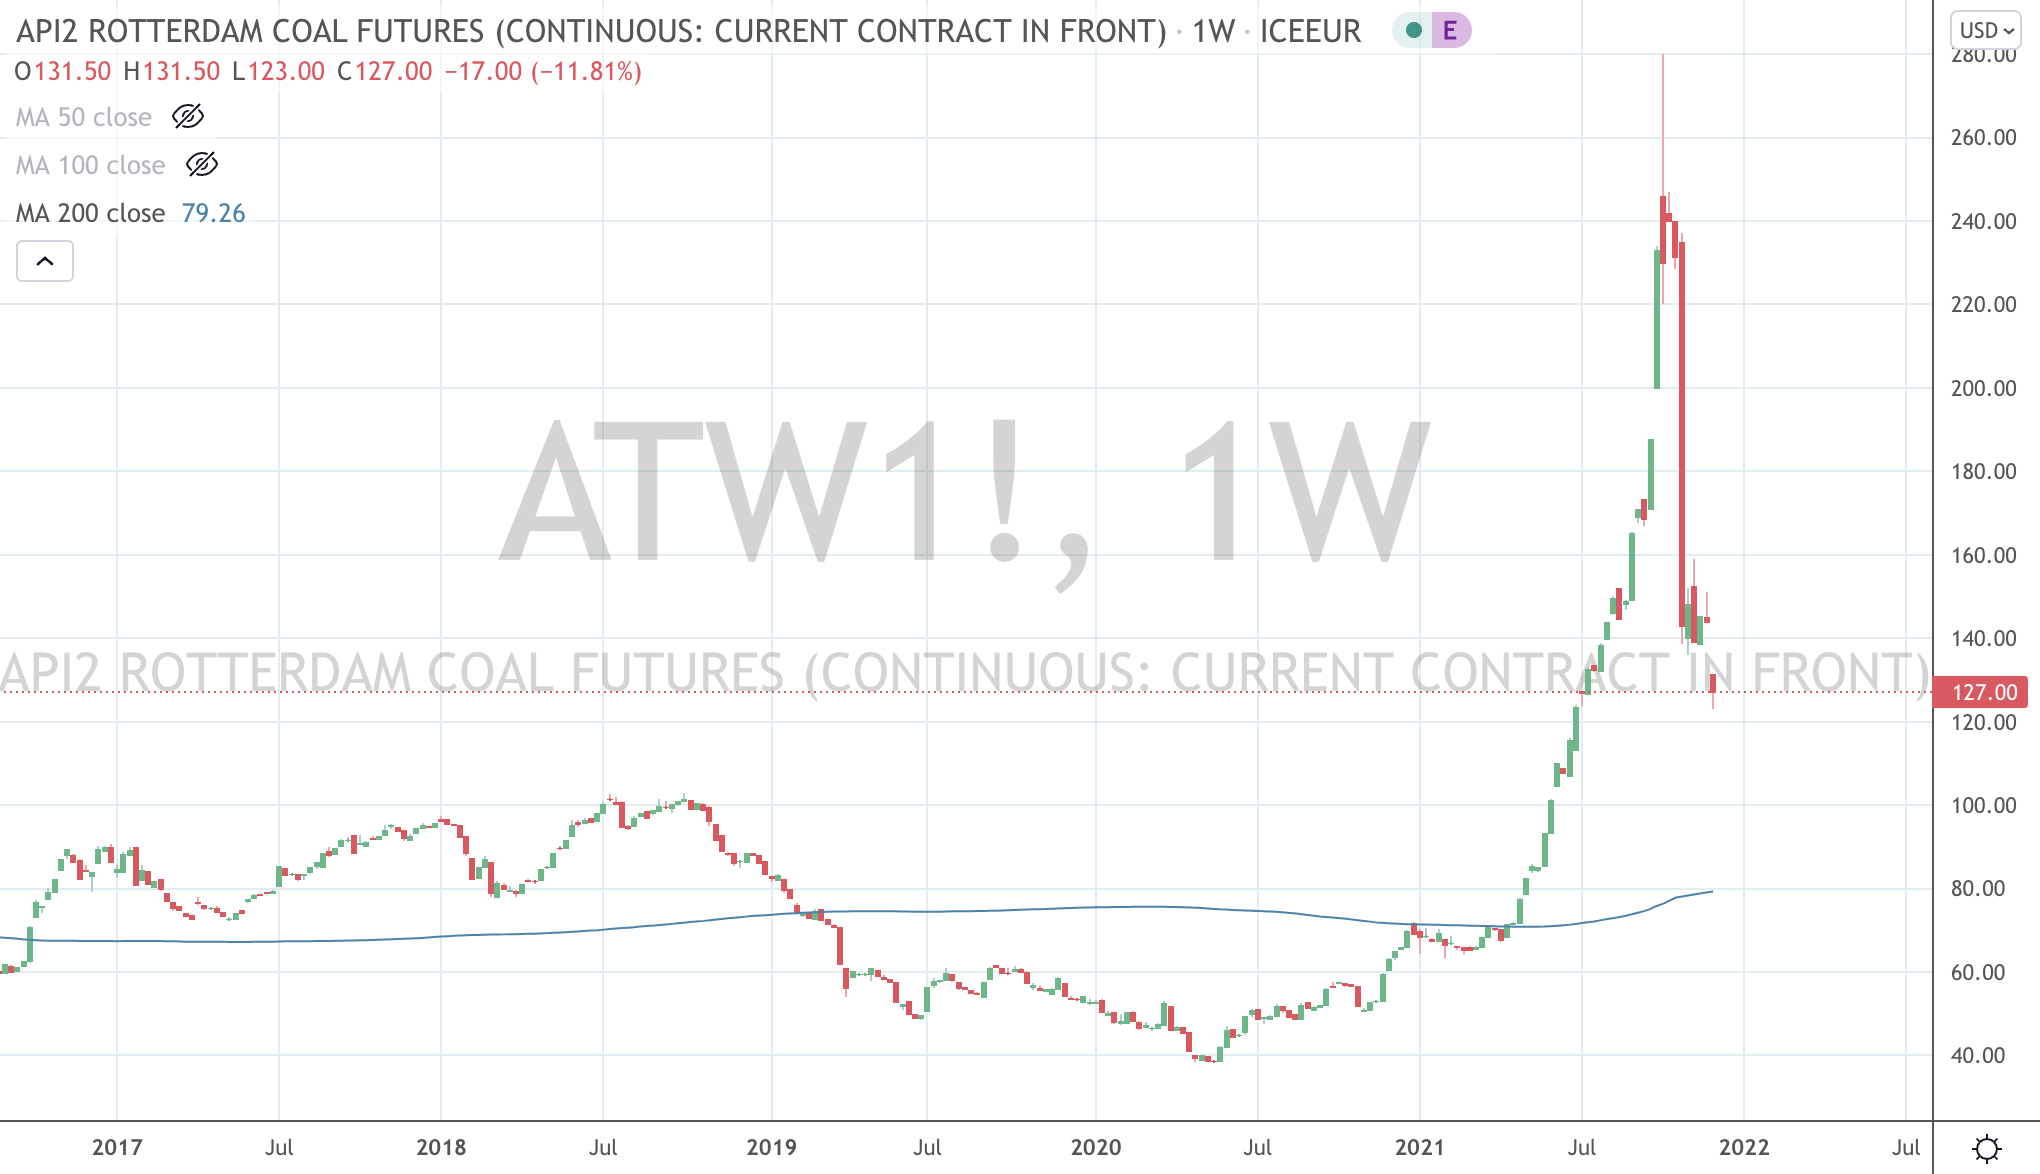
Here is another case of a parabolic price move followed by a halving in price, in very quick fashion.
The price of Rotterdam (delivered) Coal quadrupled within 6 months during the middle part of 2021, to only see it fall and now heading back towards its 200 week moving average.
I’ll check back on this one in a month or so.
November 30, 2021
by Rob Zdravevski
rob@karriasset.com.au
November 30, 2021 Leave a comment
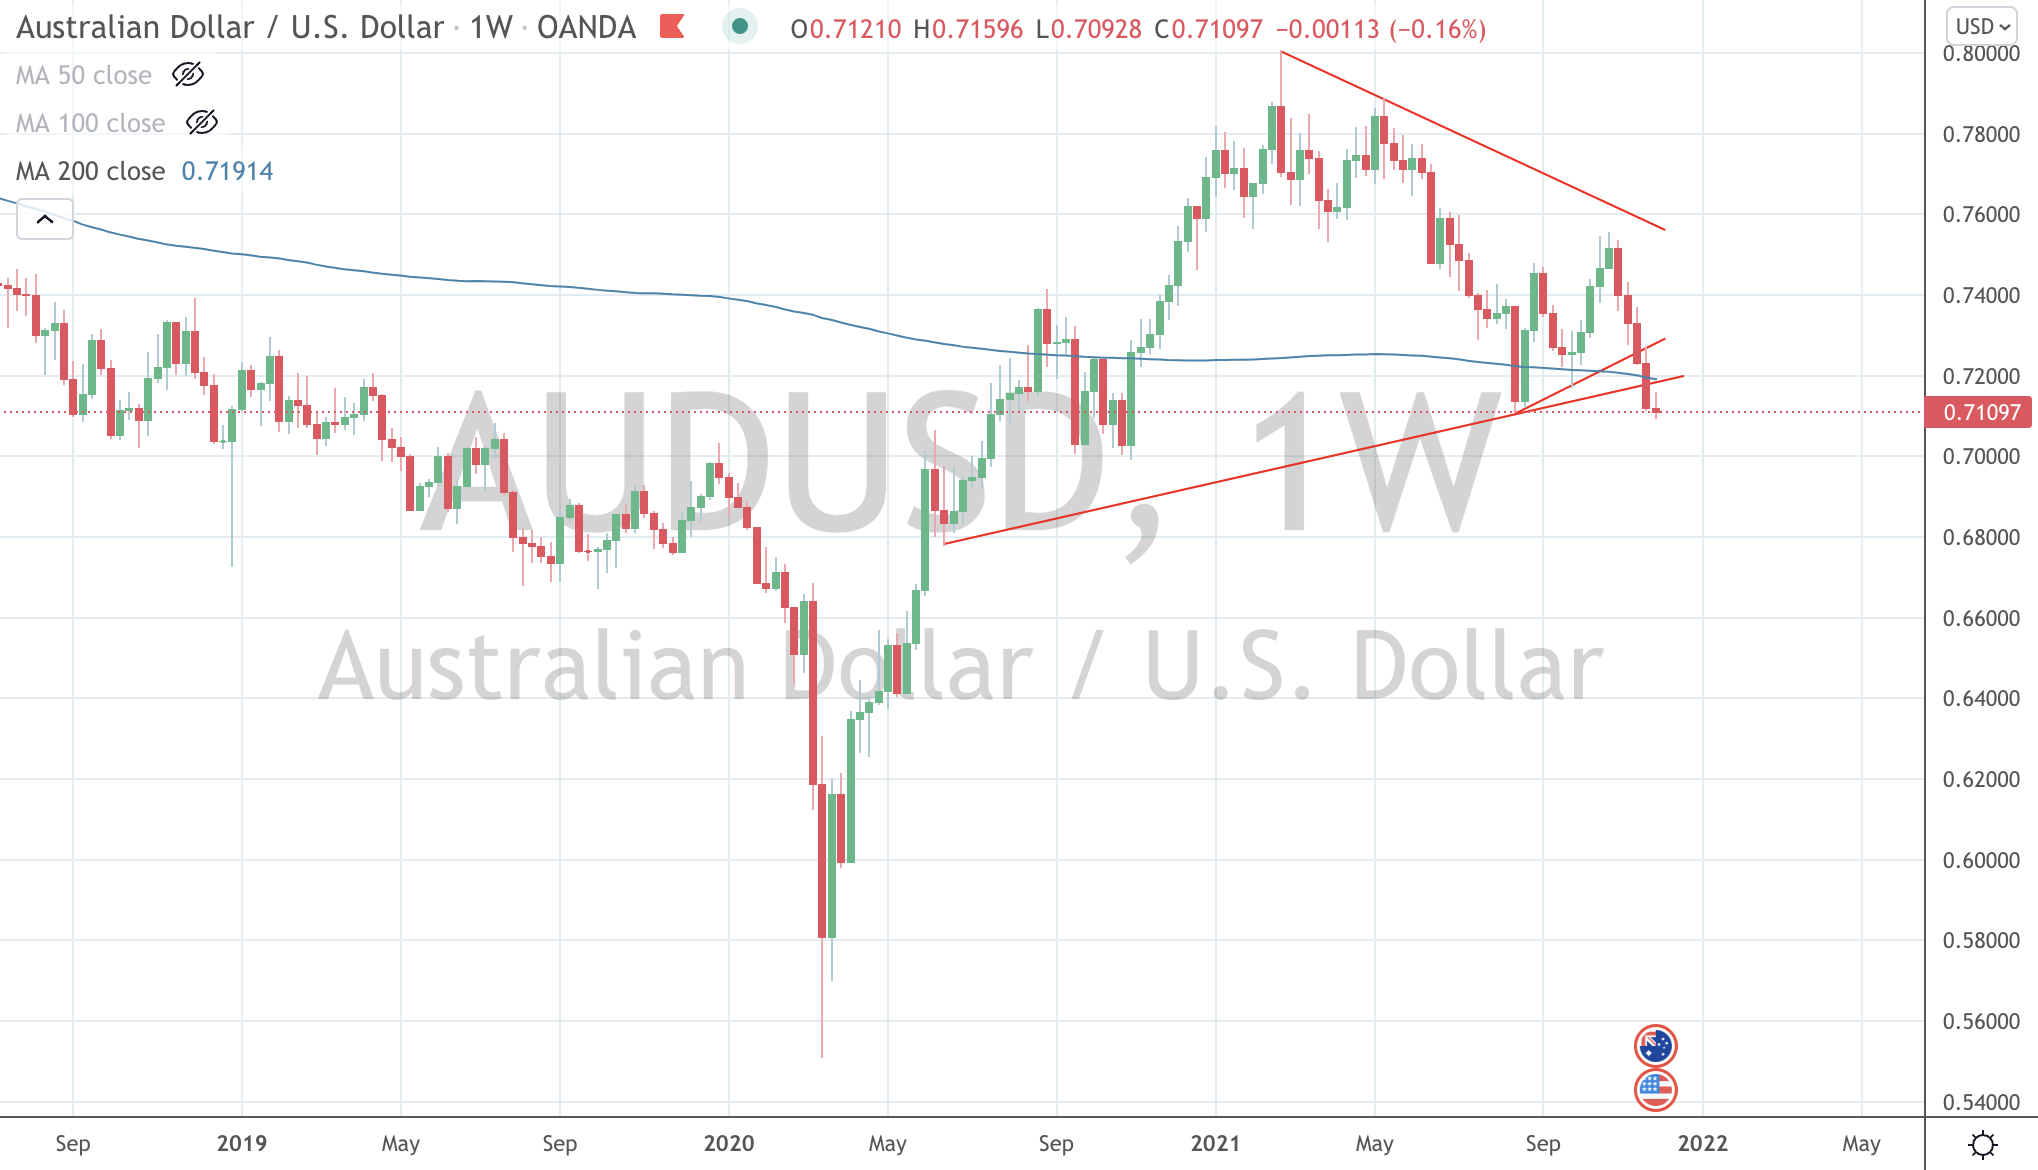
Since the 1st quarter of 2021, the AUD (versus USD) has made lower high’s and new lower low’s.
Recently it has broken some support trendlines and this week, it made a new lower low.
This suggests a move to the 0.7050 – 0.7000 area., which is where I expect support to be found along with some consolidation.
After all, the currency is in its 5th consecutive week of declines.
However, the AUDUSD has entered a new longer term bearish trend.
It would need to trade above 0.7450 to negate that view.
Failing to hold that, I’ll look for a test of 0.6930.
0.6780 – 0.6730 is the next stop below that.
November 30, 2021
by Rob Zdravevski
rob@karriasset.com.au
November 29, 2021 Leave a comment
The following assets (on a weekly timeframe) registered an Overbought reading or traded more than 2.5 standard deviations above its rolling mean.
Extremes “above” the Mean (at least 2.5 standard deviations)
Chinese government 10 year bond yield
Nasdaq 100
Nickel
(although they all peaked earlier in the week)
Overbought (RSI > 70)
the JKM “Japan/Korea (LNG) Marker”
Tin
Urea
and Australian Coal
The Overbought Quinella – Both Overbought and Traded at > 2.5 standard deviations above the weekly mean)
U.S. Dollar (DXY) Index
Coffee
Cattle
Wheat
The last two were highlighted in the following posts;
Assets (securities) which touched the other side of the extreme, being Oversold (where the RSI is < 30) or were at least 2.5 standard deviations below its mean are;
Extremes “below” the Mean (at least 2.5 standard deviations)
Hot Rolled Coil Steel (HRC)
EUR/GBP – suggesting a weaker Euro versus the British Pound
SGD/USD
TRY/USD
And Spain’s IBEX equity index
Oversold (RSI < 30)
Iron Ore
The Oversold Quinella – Both Overbought and Traded at > 2.5 standard deviations above the weekly mean.
EUR/USD – suggesting a weaker Euro
DKK/USD
SEK/USD
(These were highlighted in a mid-week note, https://robzdravevski.com/2021/11/25/currency-trade-ideas/ )
Notes & Ideas:
Volatility returned this week, but mainly on the Friday following the Thanksgiving Holiday amid lighter volume and driven by a headline on a new COVID variant.
Amongst the drubbing seen in the energy markets, it’s worthy to note the bearish outside reversal week seen in the Nasdaq, S&P 500 and SOX. My earlier note today makes further comment about this past Friday’s action.
https://mailchi.mp/karriasset/perspective-positioning-and-opportunity-1
Other observations I noticed during the week include;
This week’s list of ‘extremes’ is the smallest I’ve seen for quite some time, telling me many prices are busy meandering or heading to the other side of their range.
Bond yield aren’t featured in the list (unlike the past 2 weeks).
Hot Rolled Coil Steel is down 18% from its recent high, albeit not a dent on its 5 fold increase over the past 18 months.
The U.S. banking index only fell 1.1% for the week.
While Crude Oil fell 10% for the week, Natural Gas rose 8%.
Gasoline and other energy markets touched daily Oversold levels (but not weekly, which the timeframe basis of this periodical).
The larger advancers over the past week comprised of the Baltic Dry Index 8.4%, Iron Ore 1%, JKM 2%, Coffee 4.1%, Cattle 3.4%, Tin 2.9%, Natural Gas 8.1%, Corn 28%, and Istanbul’s BIST equity index rose 3.4%.
The group of decliners included Aluminium (2.9%), Bloomberg Commodity Index (2.3%), Cocoa (7.2%), WTI Crude Oil (10.3%), Gasoil (8.1%), Gold (3.6%), Copper (2.8%), Heating Oil (8.7%), HRC (10.8%), Lumber (4.5%), Orange Juice (2.9%), Platinum (7.9%), Gasoline (10.4%), Sugar (3.2%), Silver (6.8%), CRB Commodity Index (3.5%), Brent Crude (7.1%), Gold in AUD (2.9%), Rice (1.9%), Chinese Coal (2.2%), Urea (2.1%), Bitcoin (7.9%), Ethereum (5.7%), Cardano (19%), AEX (4.9%), CAC (5.2%), DAX (5.6%), Dow Jones Industrial Average (2%), DJ Transports (1.8%), FTSE MIB (5.4%), HSCEI (4.4%), HSI (3.9%), IBEX (4%), S&P Midcap 400 (3.3%), MOEX (4.4%), Nasdaq (3.3%), Nikkei (3.3%), Sensex (4.2%), Oslo (3.9%), Copenhagen (4%), Helsinki (3.7%), Russell 2000 (4.2%), SMI (2.8%), SOX (4%), S&P 500 (2.2%), STI (2%), TAEIX (2.5%), Nasdaq Transports (2.5%), UK FTSE 100 (2.5%) and Australia’s ASX 200 fell 1.6% for the week.
November 29, 2021
by Rob Zdravevski
rob@karriasset.com.au
November 29, 2021 Leave a comment
Today’s newsletter makes comment about Friday’s market moves.
What I think about the ‘market’ is entirely different to what I think about specific stocks and other asset classes.
I guess, there is always something to do and other places to look, when it comes to investing.
https://mailchi.mp/karriasset/perspective-positioning-and-opportunity-1
