Macro Extremes (week ending January 28, 2022)
January 29, 2022 Leave a comment
Extremes “above” the Mean (at least 2.5 standard deviations)
Japanese 10 year government bond yields
U.S. 10 year government bond yields
TBX
US dollar Index (DXY)
Orange Juice
Nickel;
Soybean
Palladium
Overbought (RSI > 70)
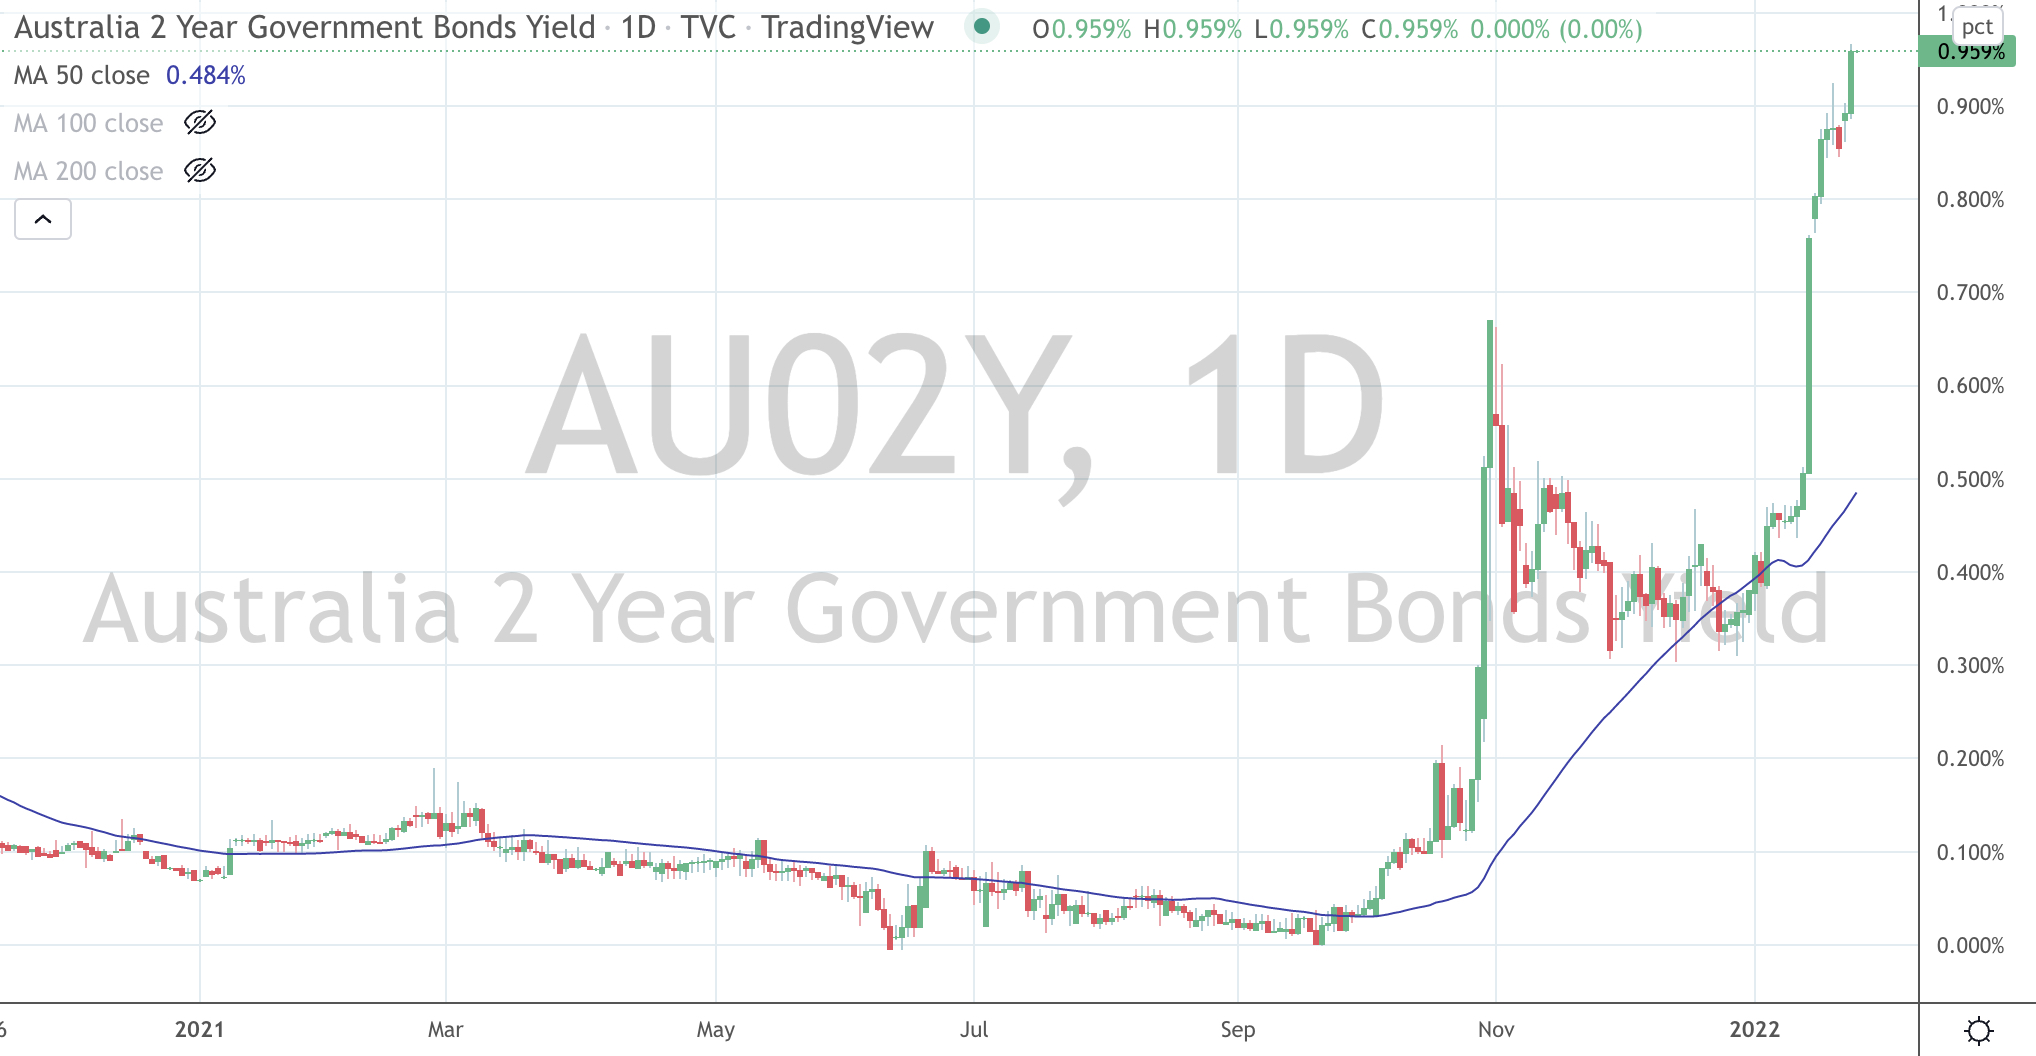
Australian 2 and 5 year bond yields
U.S. 5 year government bond yields
Greek 10 year government bond yields
Russian 10 year bond yields
Australian Coal
CRB Index
Bloomberg Commodity Index
Cotton
Heating Oil
Gasoil
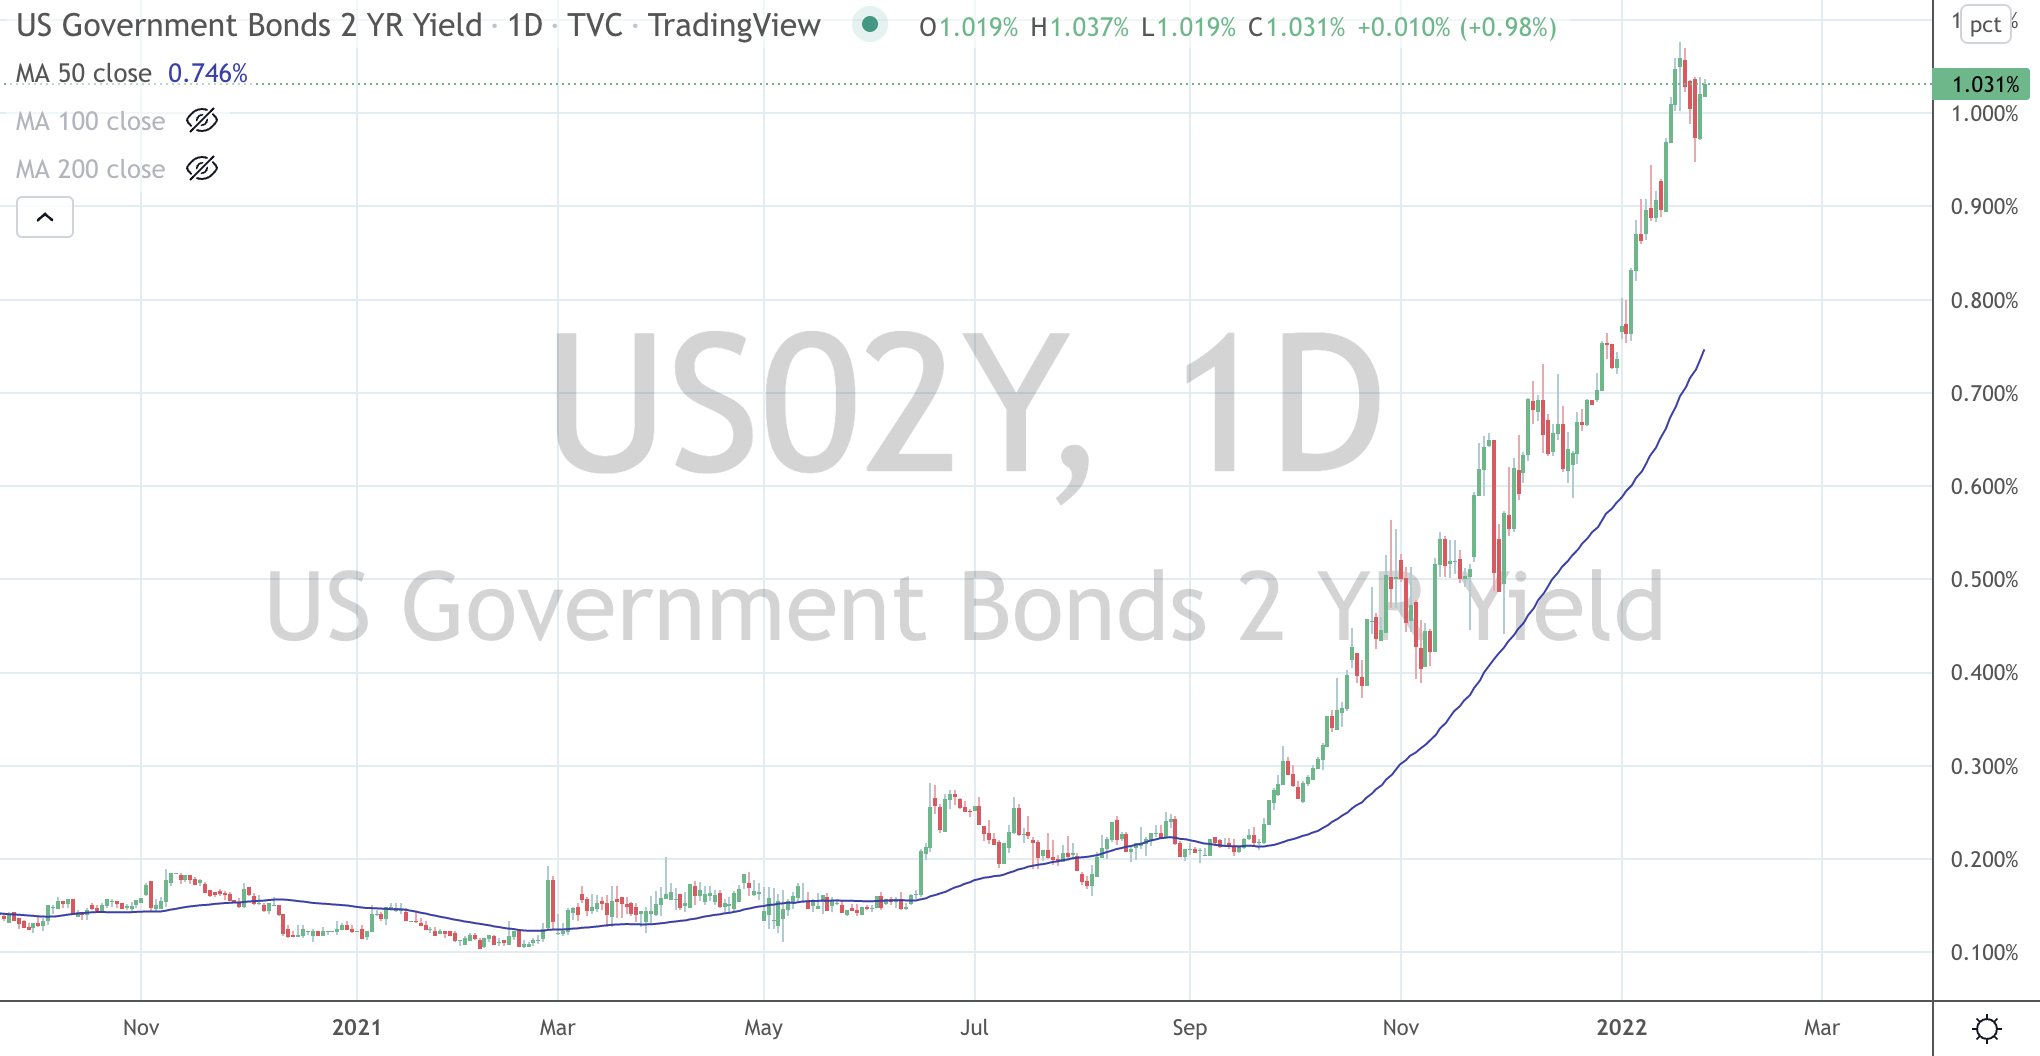
The Overbought Quinella – Both Overbought and Traded at > 2.5 standard deviations above the weekly mean)
U.S. 2 year government bond yields
Iron Ore
Extremes “below” the Mean (at least 2.5 standard deviations)
Chinese government 10 year bond yields
Amsterdam’s AEX Index
Shanghai Composite
CSI 300
Dow Jones Industrial Average
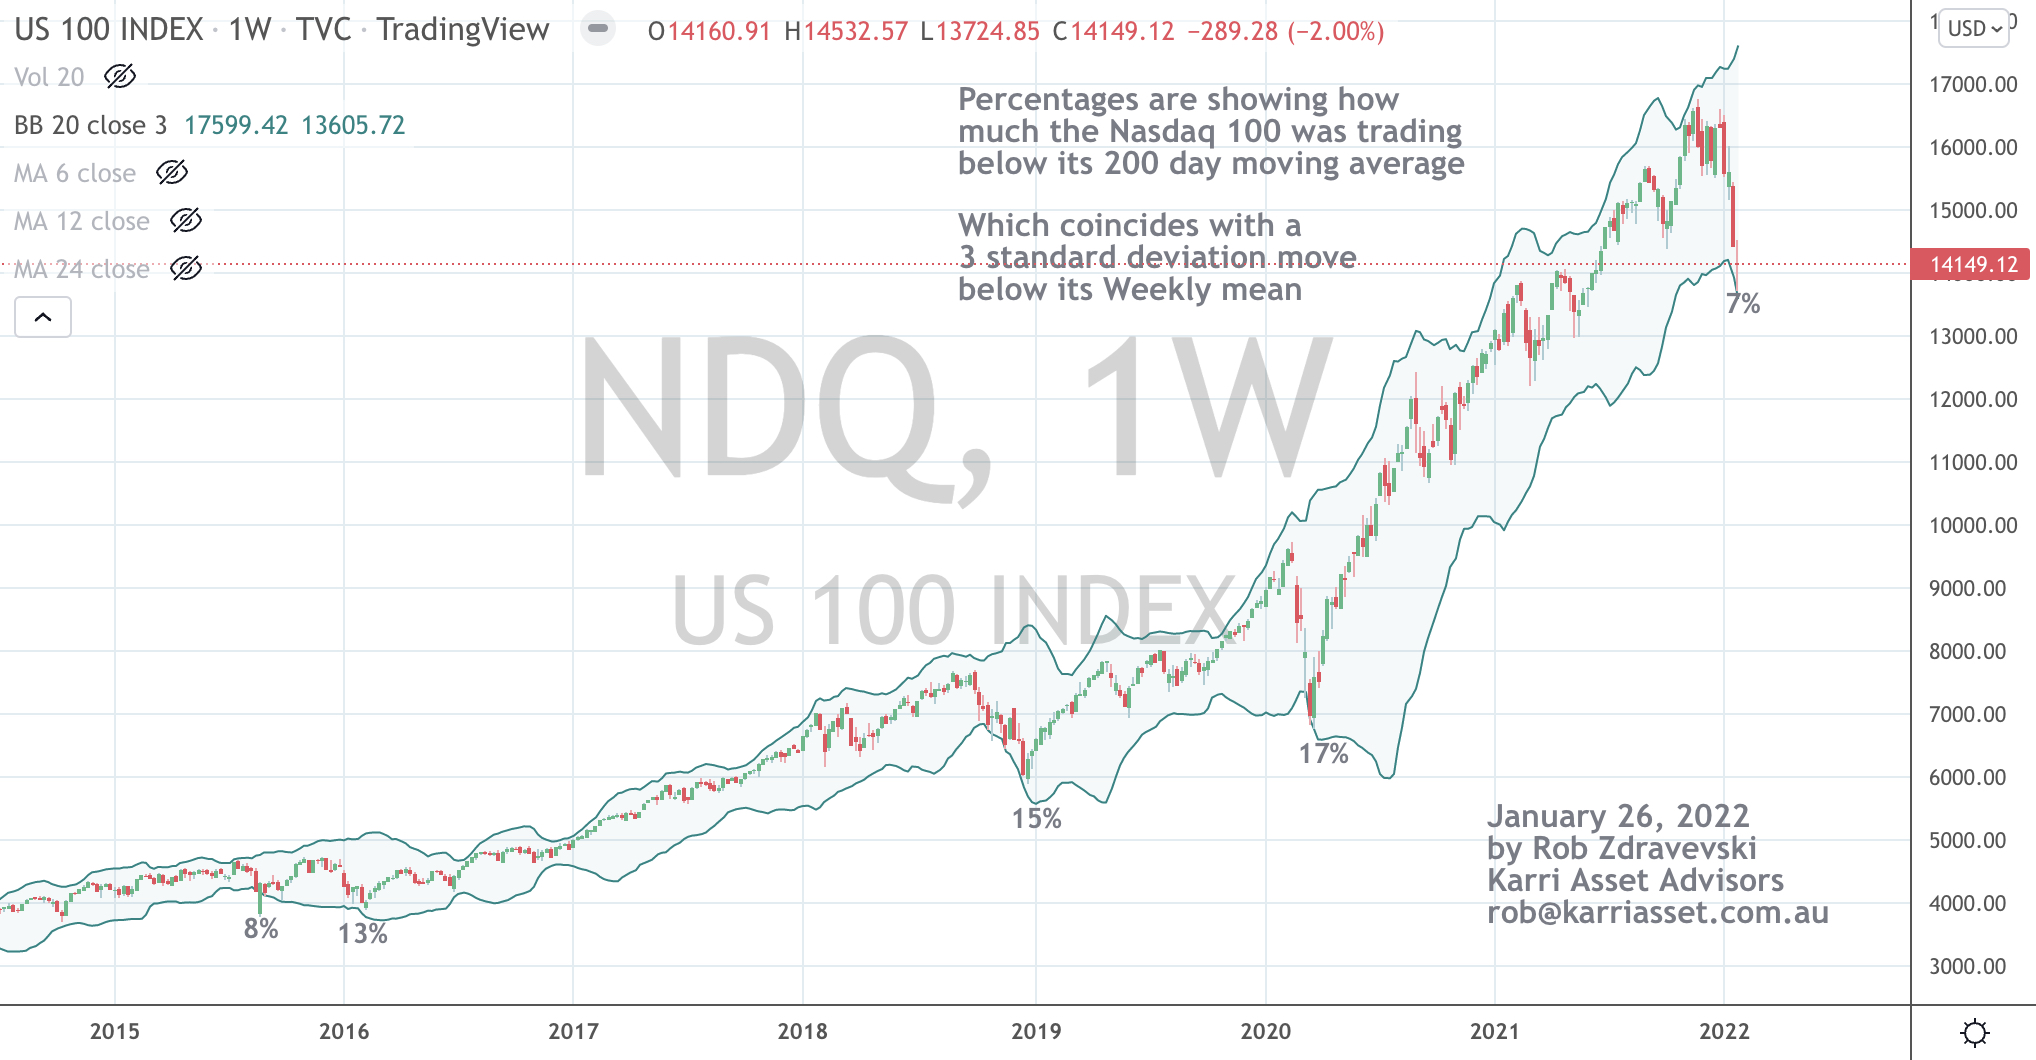
Nasdaq 100
Nikkei 225
S&P 400 MidCap
Russell 2000
S&P 500
Nasdaq Transports
ASX 200
And the Copenhagen and Helsinki indices
Oversold (RSI < 30)
EUR/USD
DKK/USD
KRW/USD
SEK/USD
RUB/USD
The Oversold Quinella – Both Overbought and Traded at > 2.5 standard deviations above the weekly mean)
Hot Rolled Coil Steel (HRC)
Korea’s KOSPI Index
Notes & Ideas:
The intra-week volatility was something to behold although we tend to see 5-12 days per year where stocks and markets are up and down 3% either way, all within a single day.
After all of the wickedness, the Nasdaq was flat for the week, while the Dow Jone Industrials and S&P 500 were up 1% for the week.
Koprea’s KOSPI hit a 14 month low and features in this week’s Oversold ‘extreme’ list.
In other news, the AUD versus the USD, fell 2.5%, the German 10 years could trade out of their negative yield.
Aussie 10 year bond yields traded to a high of 2.05% before closing the week at 1.92%, while the Australian 2’s touched 1.03% to close the week at 0.95%.
Amongst the panic, interesting Gold and Silver didn’t find a safe haven bid, instead they fell 2.3% and 8.3% respectively.
Energy had a strong week, as it enters Overbought extremes (subjectively suggesting that geopolitical tensions are mainly factored in), Softs generally rose while Dr. Copper looks like rolling over.
Steel remains Oversold, as HRC prices fell 18%.
In the face of diplomacy tensions, Russia’s MOEX Index rose 1.4%.
And as predicated in last week’s edition, the ASX 200 Index did trade down to an extreme 2.5 standard deviation reading below its weekly mean.
The larger advancers over the past week comprised of;
Rotterdam Coal 12.6% (up 45% in 3 weeks), WTI Crude 2% (up 15% in 4 weeks), Gasoil 4.3%, Iron Ore 6.4%, JKM 6.1%, Coffee 1.7%, Natural Gas 16%, Brent Crude 3.4%, Dutch TTF Gas 16.2%, CRB Index 1.8%, Gasoline 3.9%, Heating Oil 3.5%, Lean Hogs 2%, Aluminium 3.4%, Corn 3.2%, Soybean 3.9%, Oats 8.4%, Palladium 12.9%, Cotton 2.5%, Brazil’s Bovespa 2.7% and Russia’s MOEX Index rose 1.4%.
The group of decliners included ;
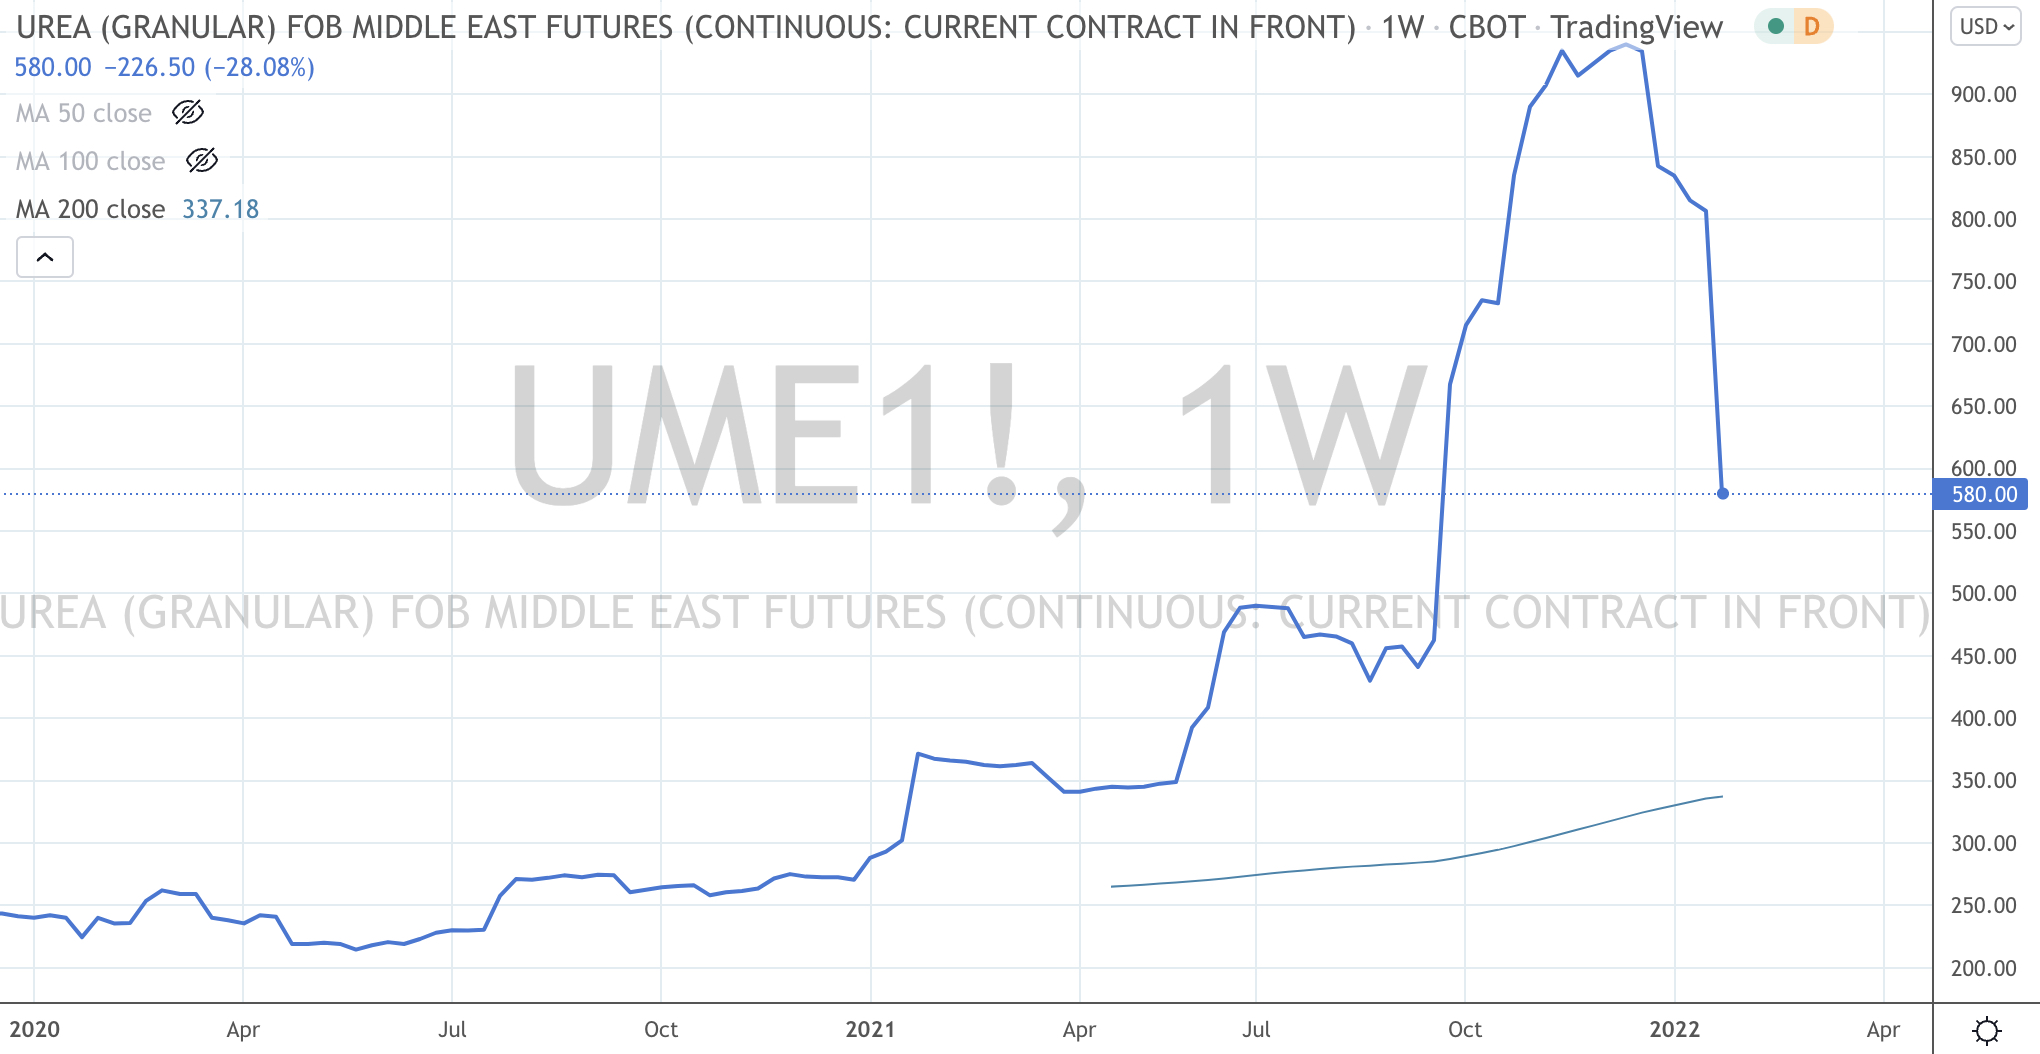
Baltic Dry Index (2.4%) (having fallen 80% in 5 weeks), Copper (4.7%), Orange Juice (3.5%), Platinum (2.8%), Silver (8.3%), Urea (17.5%), Sugar (3.7%), Nickel 6.9%, Lumber (10.4%), HRC (17.9%), Gold (2.3%), Cocoa (3.2%), Silver (8.3%), Uranium (2.4%), Shanghai Composite (4.6%), AEX (2.6%), China’s CSI 300 (4.5%), DAX (1.8%), MIB (1.8%), HSCEI (6.6%), Hang Seng (5.7%), Kospi (6%), Nikkei (2.9%), Sensex (3%), Copenhagen (2.8%), Stockholm (2%), Helsinki (2.4%), Philadelphia SOX (3.8%), Switzerland’s SMI (2%) and Australia’s ASX 200 fell (4.7%).
January 29, 2022
by Rob Zdravevski
rob@karriasset.com.au