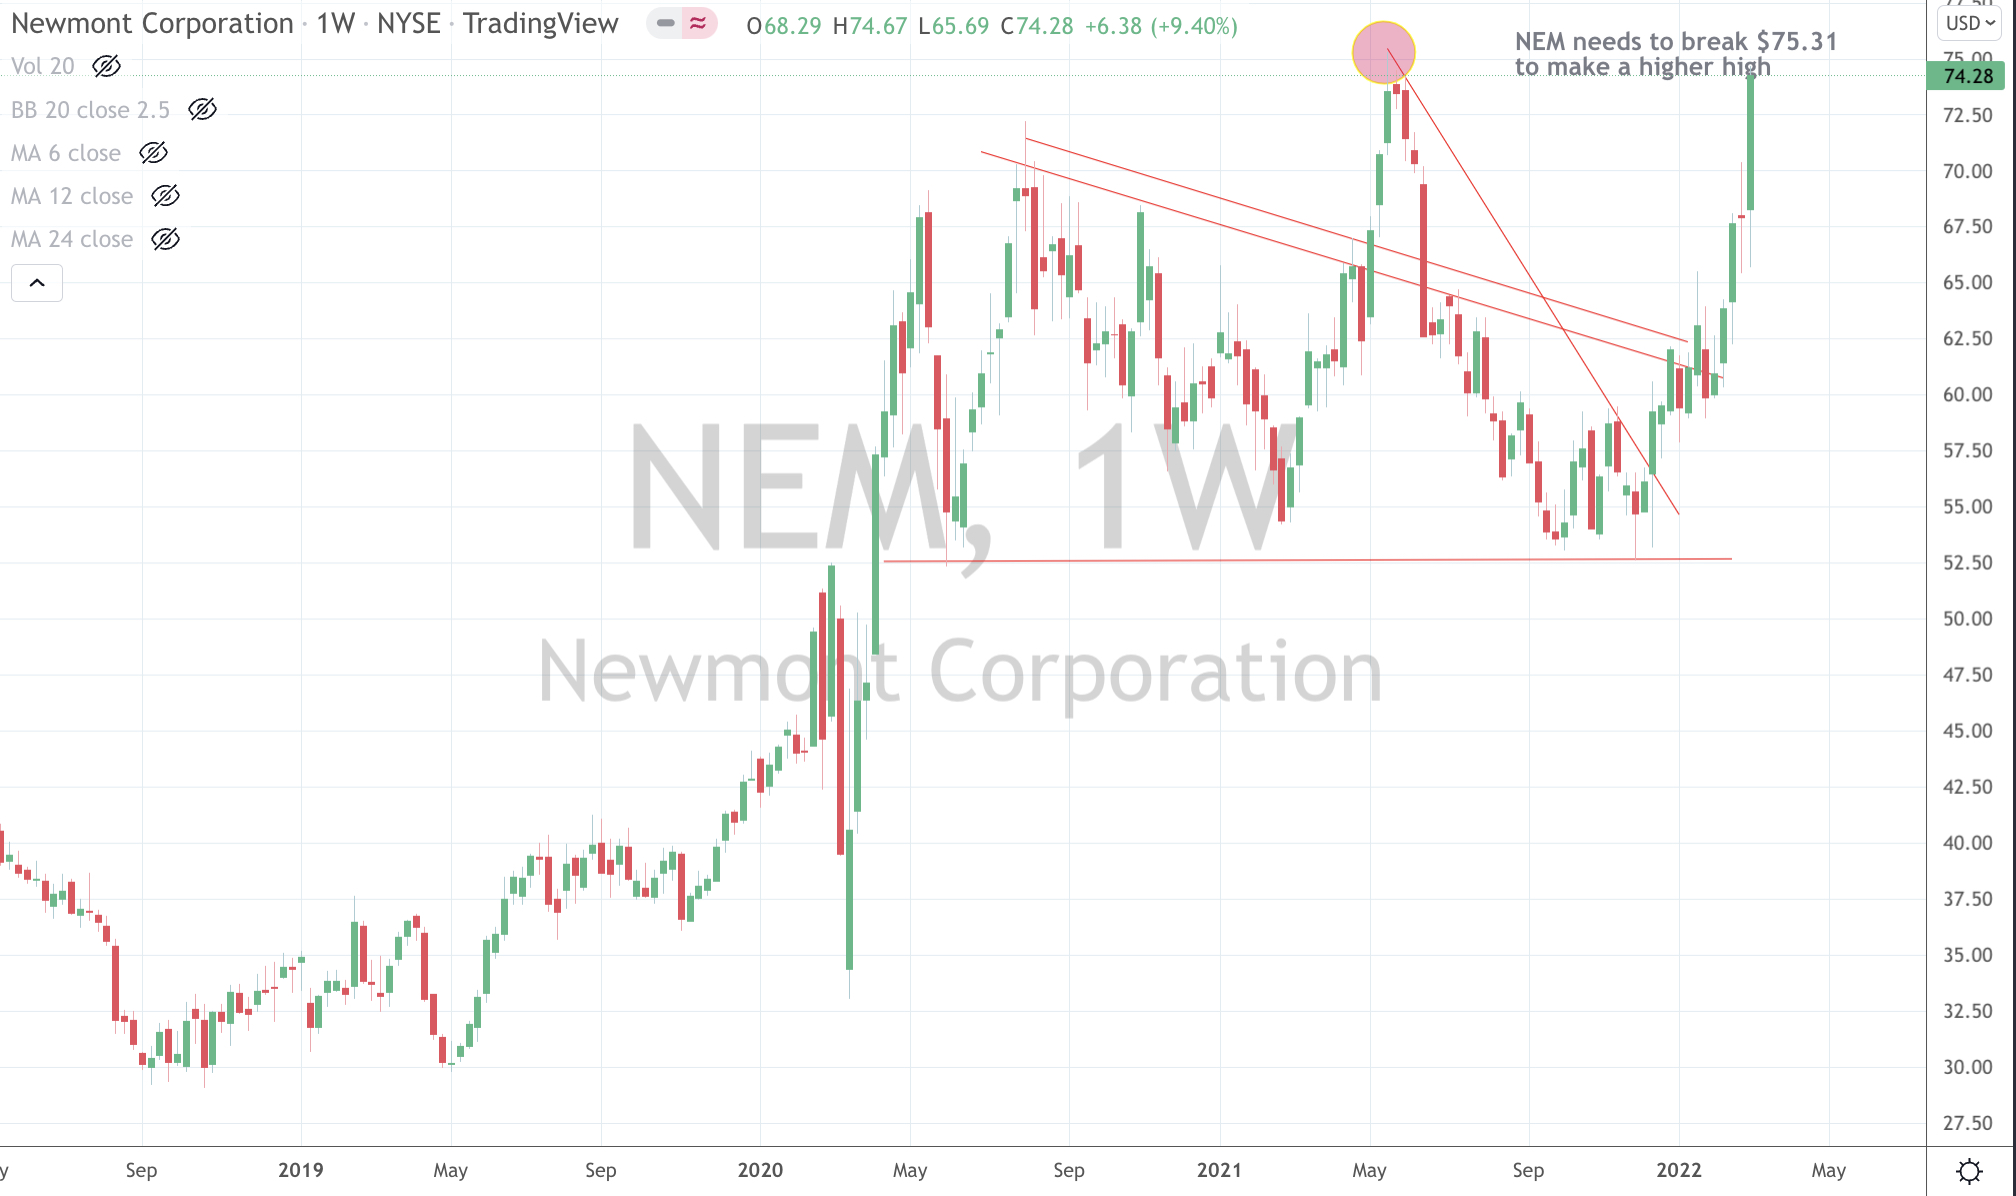
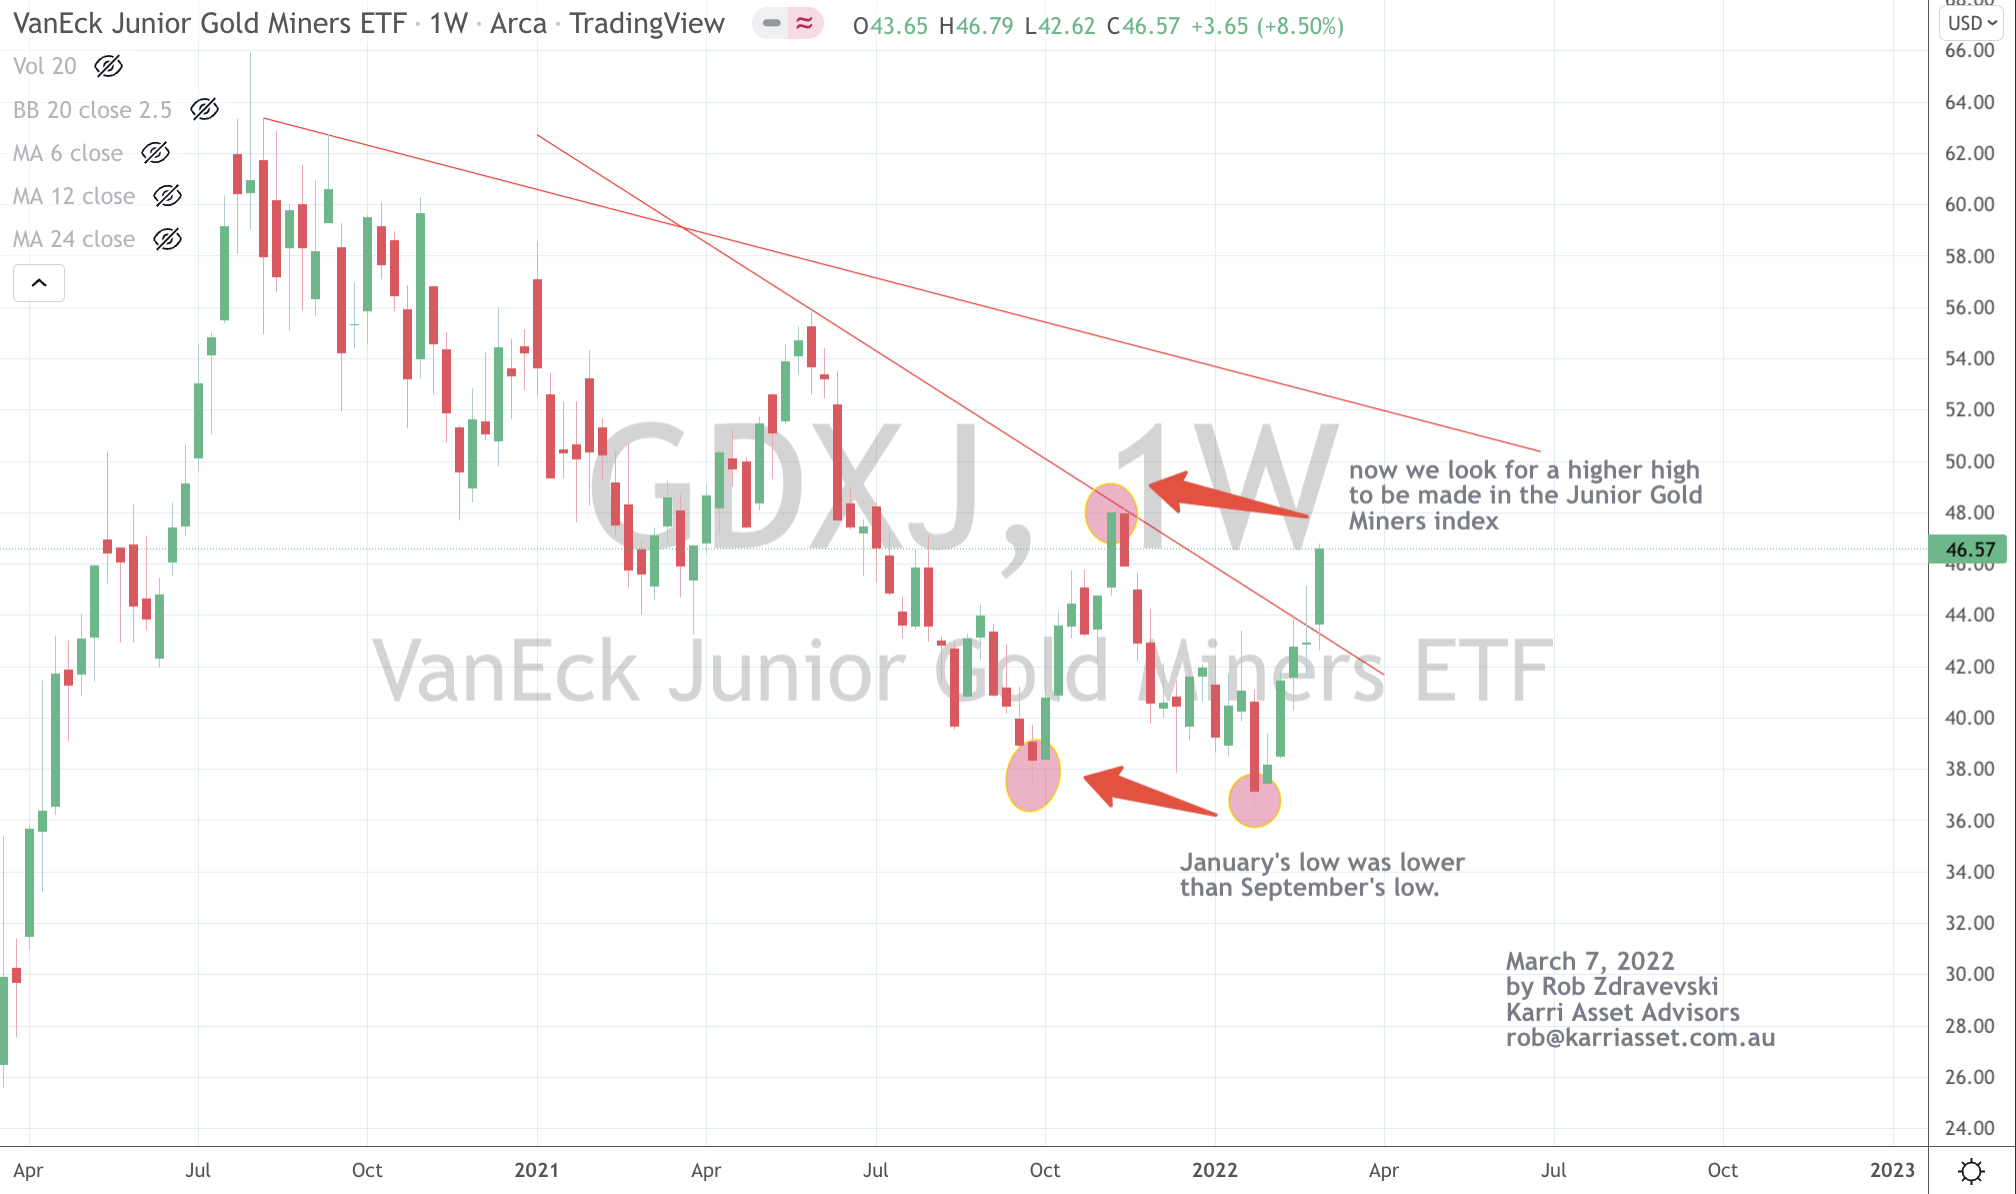
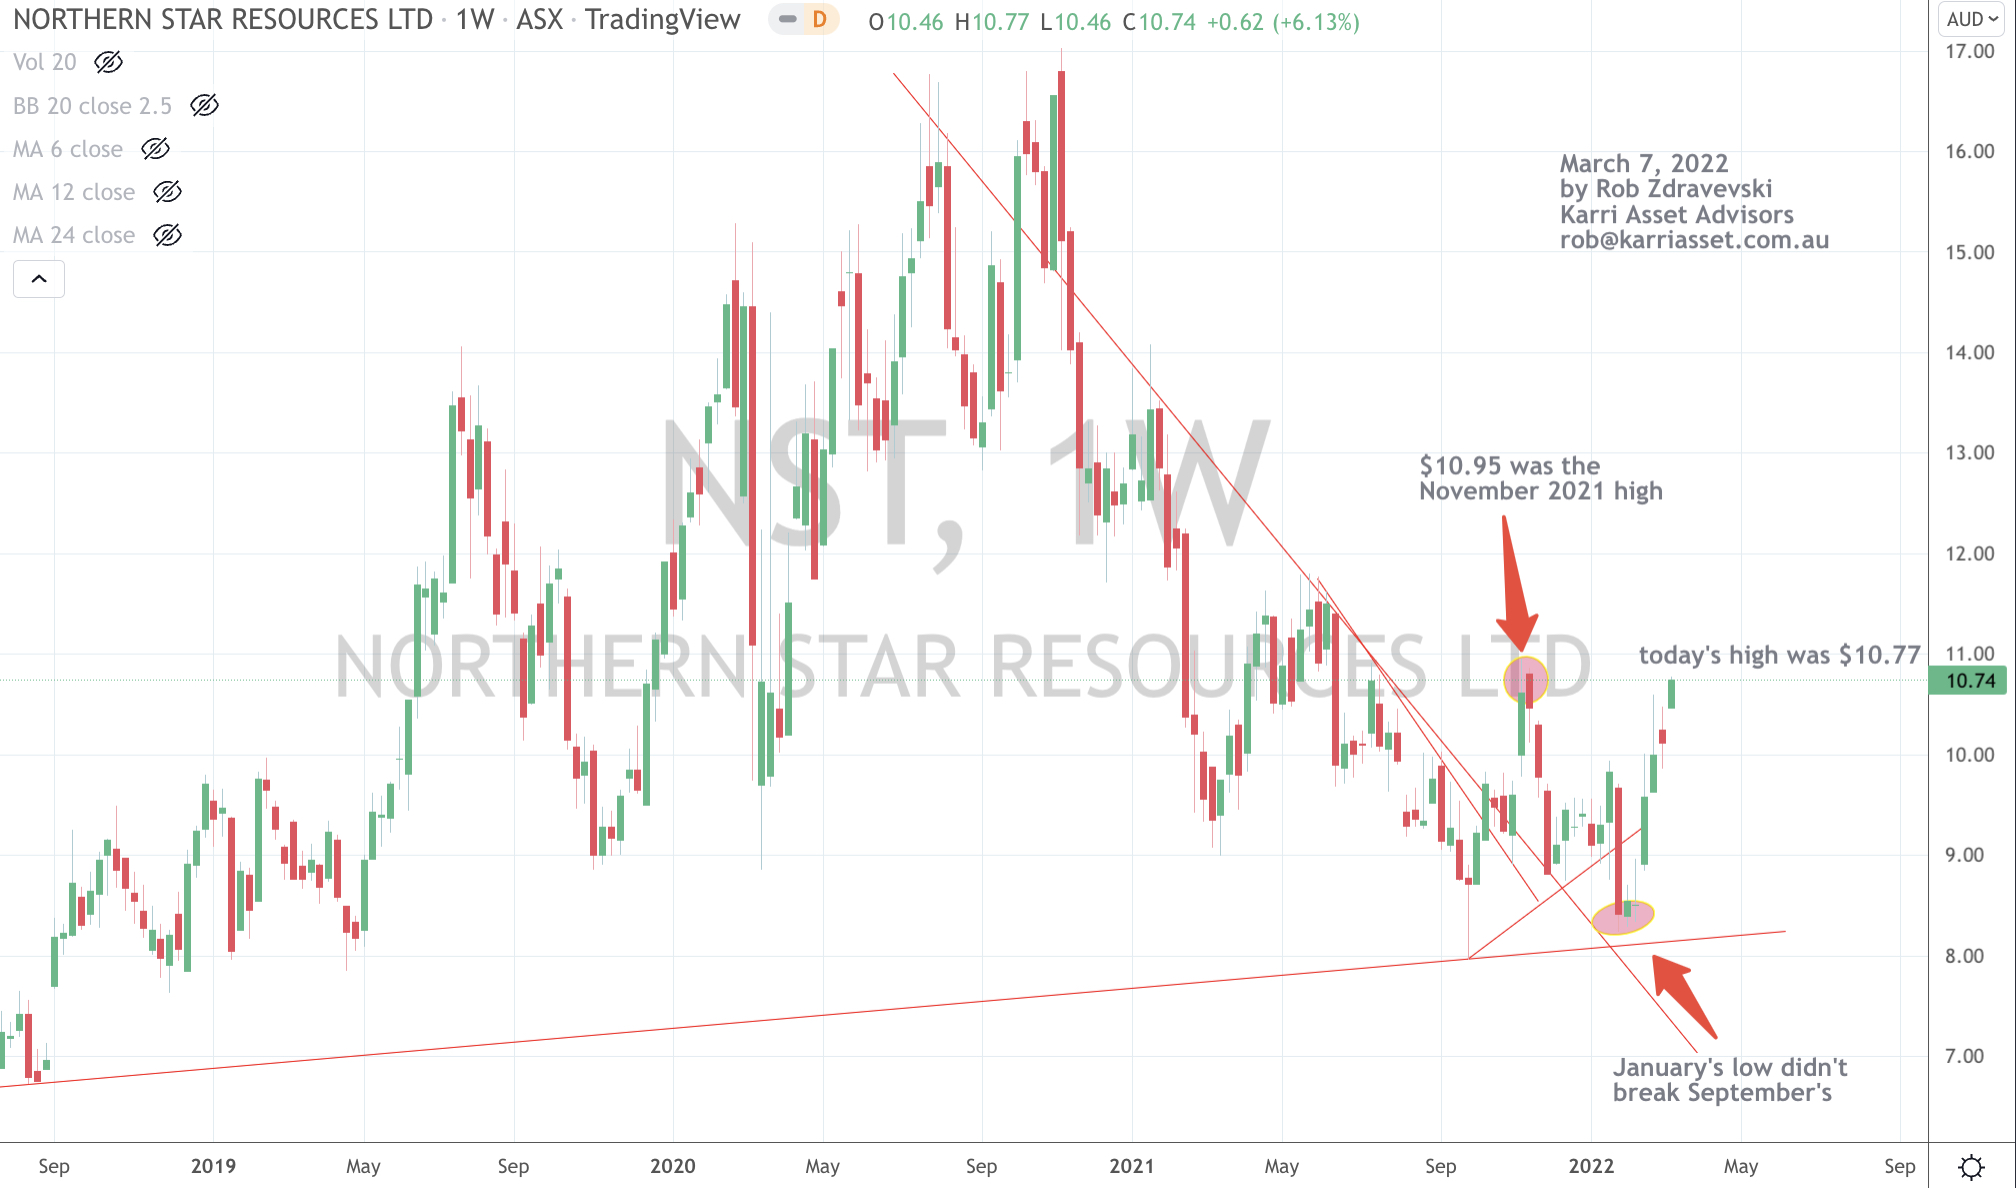
In the coming days, I’m watching whether gold stocks make higher highs than those seen a few months ago.
This will help decide if we see a further leg higher.
This is important (and against growing probability) because the Gold price has just touched a weekly overbought extreme in RSI and my preferred greater 2.5 standard deviation.
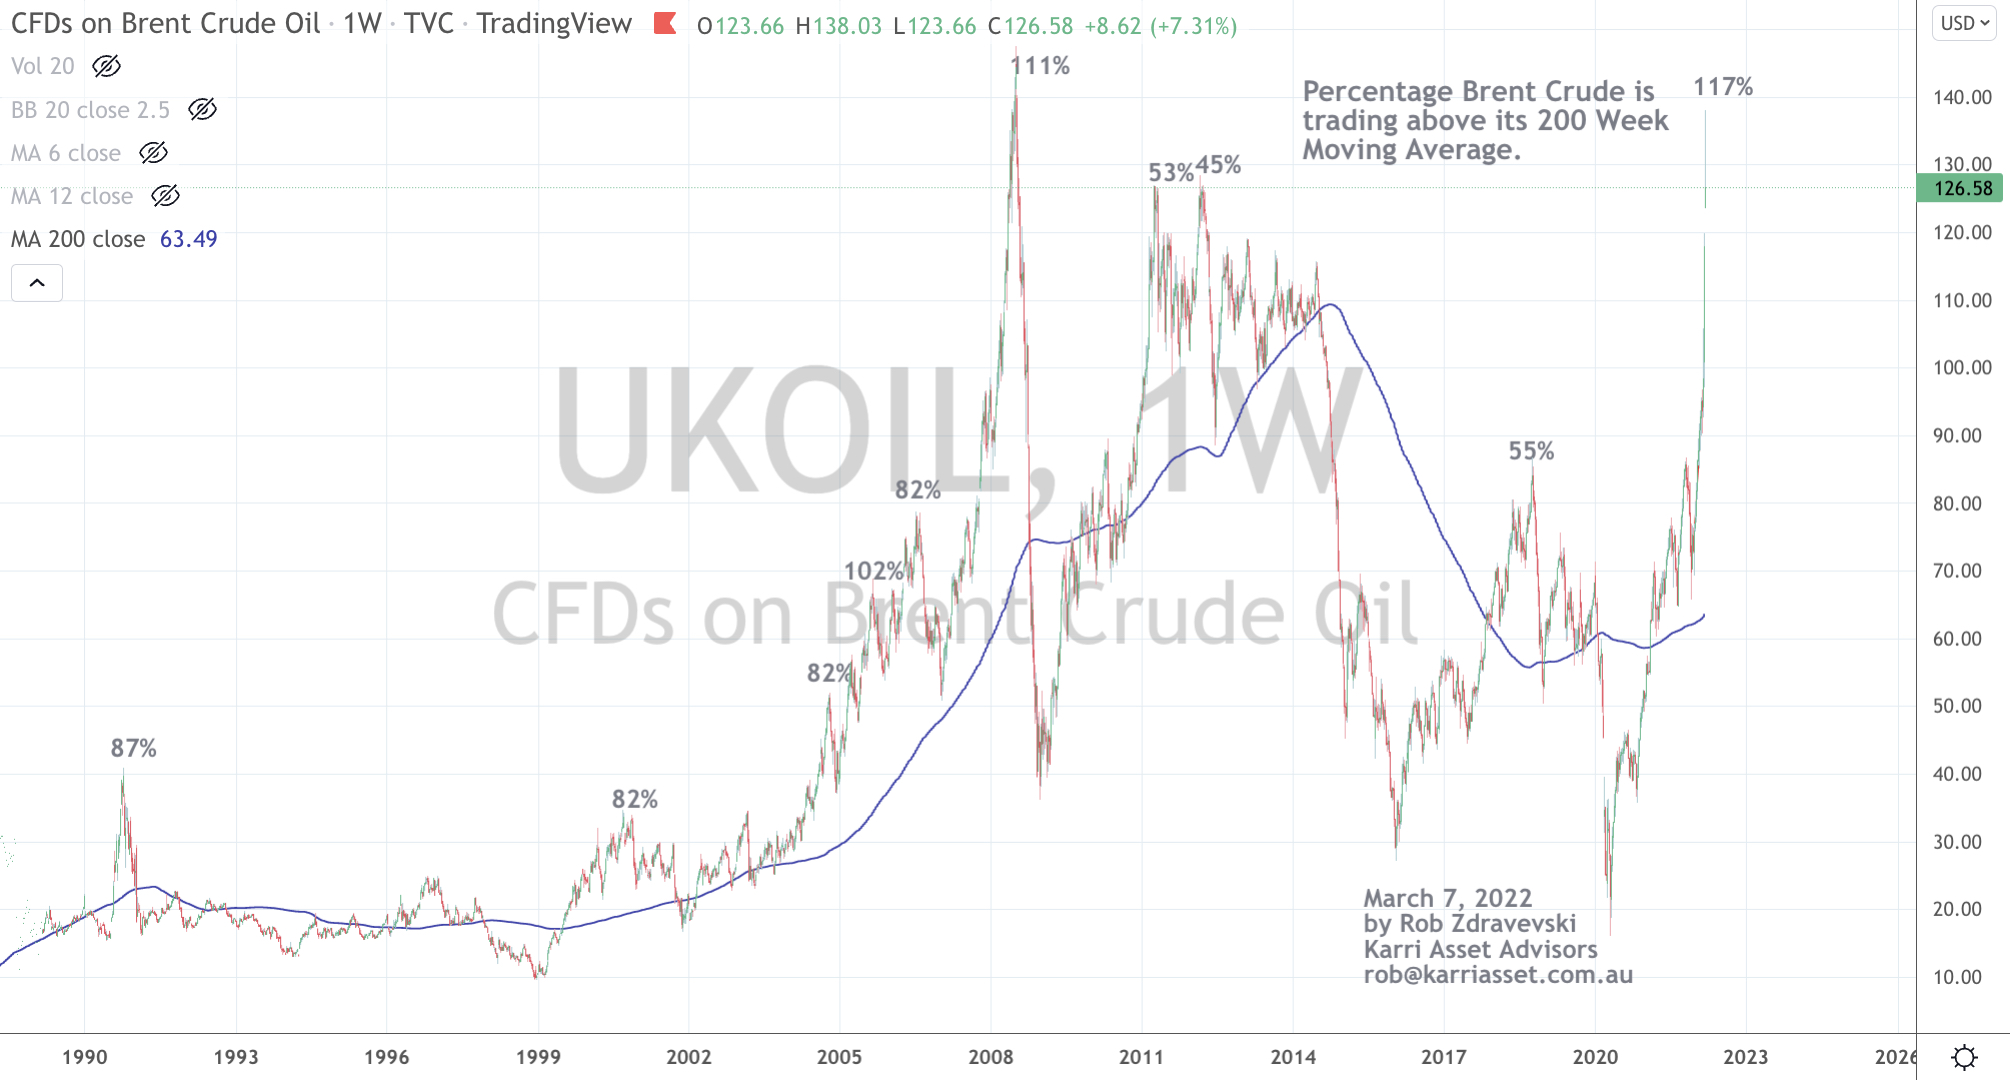
The charts below feature the prices of Newmont and the U.S. junior gold miners index along with Australia’s Northern Star Resources and Evolution Mining.
The following assets (on a weekly timeframe) registered an Overbought reading or traded more than 2.5 standard deviations above its rolling mean.
Extremes “above” the Mean (at least 2.5 standard deviations)
Gold
LNG
Copper
USD Index (DXY)
Uranium
Overbought (RSI > 70)
Australian 2, 3 and 5 year government bond yields
U.S. 2 year government bond yields
Greek & New Zealand 10 year government bond yields
Tin
Soybean
The Overbought Quinella – Both Overbought and Traded at > 2.5 standard deviations above the weekly mean)
Russian 10 year government bond yields
Bloomberg Commodity Index
CRB Index
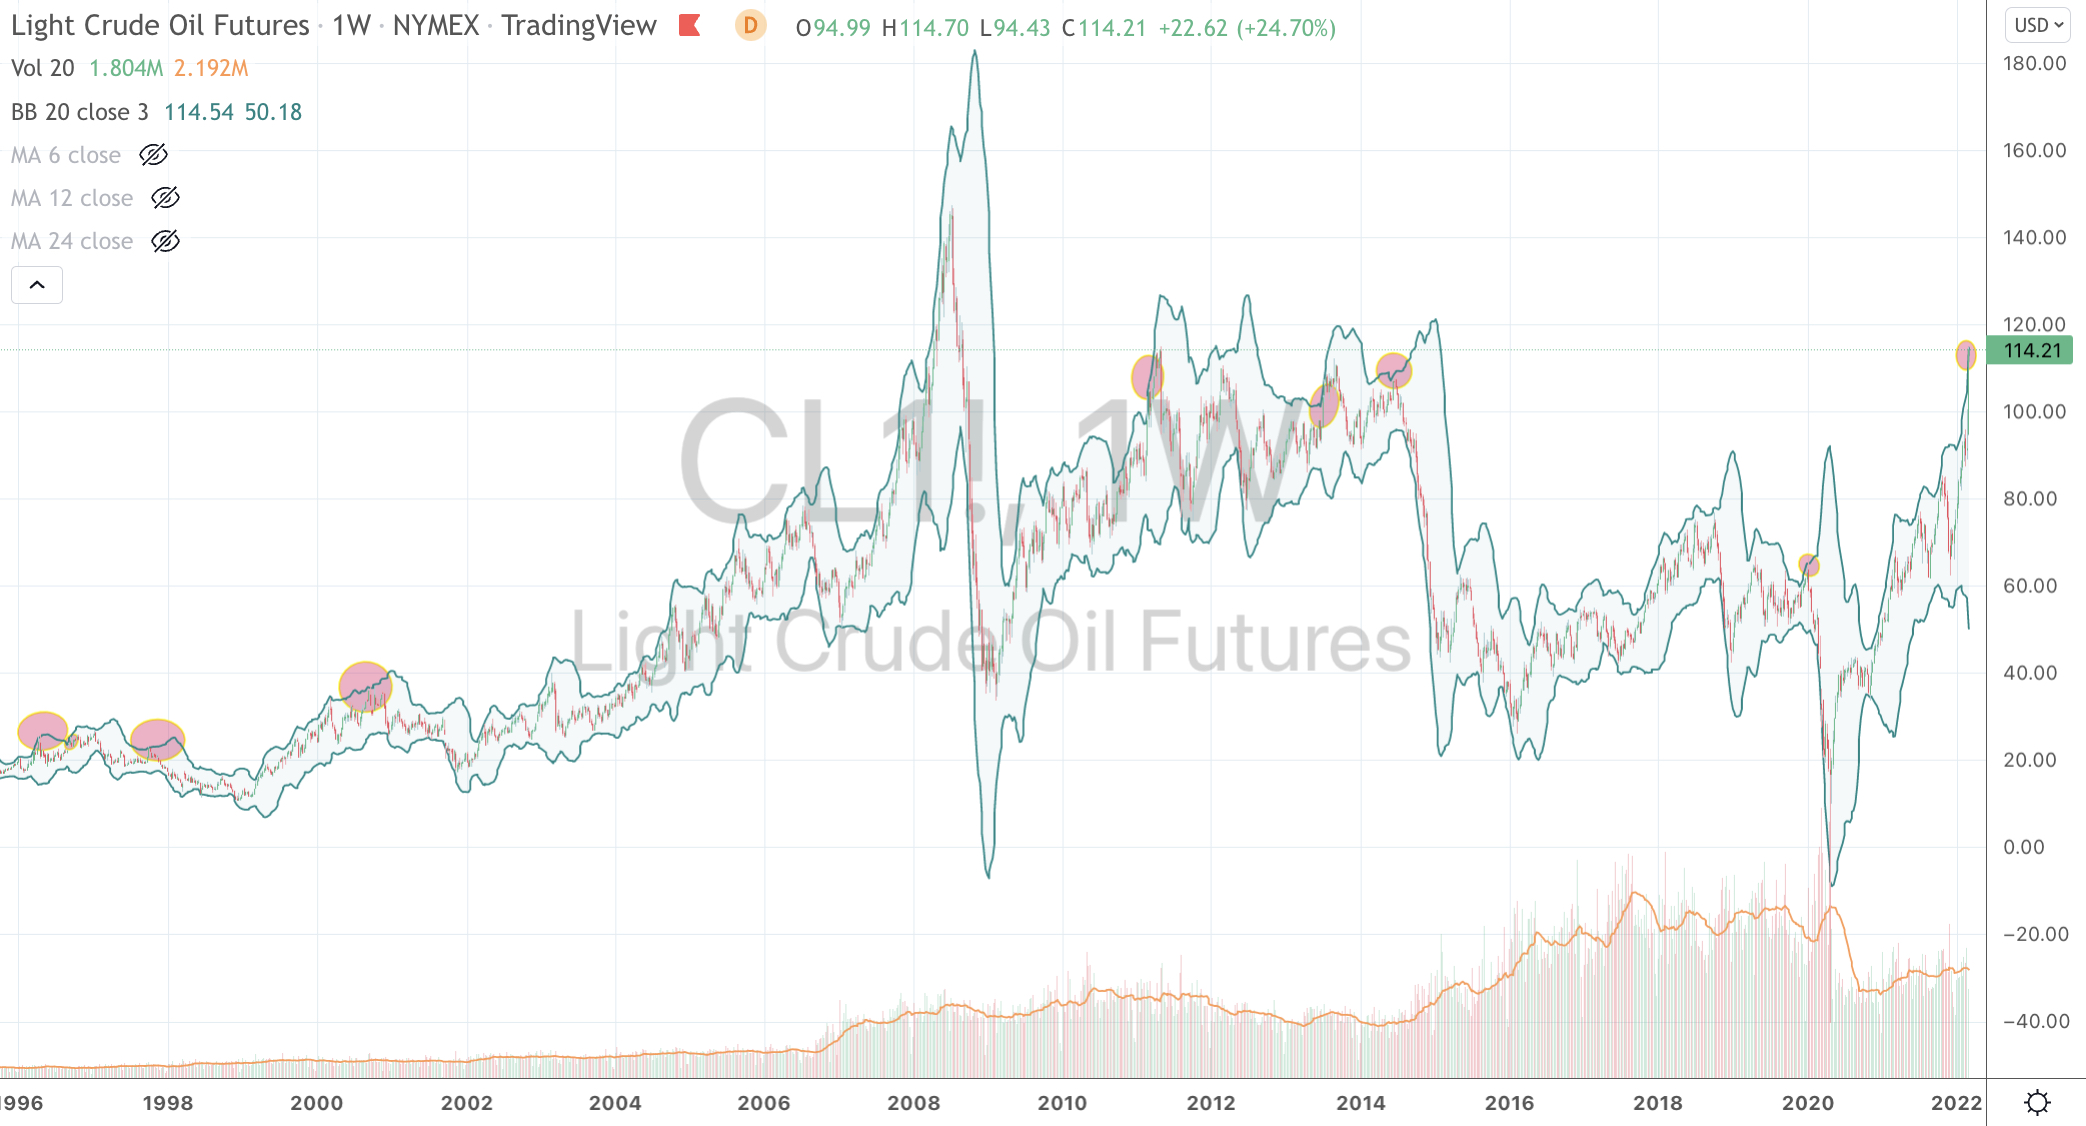
WTI Crude Oil
Brent Crude Oil
Gasoline
Heating Oil
Gasoil
Dutch TTF Gas
Aluminium
Rotterdam Coal
Australian Coal
Palladium
Nickel
Corn
Wheat
Rice
Nikkei 225 Index
Gold Volatility Index
Assets (securities) which touched the other side of the extreme, being Oversold (where the RSI is < 30) or were at least 2.5 standard deviations below its mean are;
Extremes “below” the Mean (at least 2.5 standard deviations)
KRW/USD
EUR/AUD
EUR/USD
DKK/USD
SEK/USD
RUB/USD
Dow Jones Industrial Average
Sensex
Swiss SMI
Oversold (RSI < 30)
U.S. 10 year minus 2 year government bond yield spread
(Now at the same level as March 9th, 2020)
The Oversold Quinella – Both Overbought and Traded at > 2.5 standard deviations above the weekly mean)
AEX, CAC, DAX, MIB, IBEX, Helsinki & Stockholm equity indices
Notes & Ideas:
It was a “relative” mute week for American indices but not so for European counterparts.
Helsinki’s bourse took a bruising by falling 11.4% in the week, due to proximity to Russia and murmurs of them yielding neutralism and possibly joining NATO, while France;s CAC and the German DAX both 10% for the week.
It was a week for the record books.
While the biggest news in in the energy complex, there are interesting parables such as Natural Gas still not above its September 2021 highs.
Some of the moves were extraordinary. Rotterdam delivered coal rose 99% in a week and Gasoil (diesel) soared 42%.
The second biggest news is the moves in bond yields.
Aussie 10’s (which aren’t overbought) moved from 2.25% to 2.10%.
Canadian 10’s yields fell from 1.90% to 1.66%, while the yield in French 10’s collapsed from 0.70% to 0.44%.
Inversely, the Russian Central Bank double its policy rates and thus the traded 10’s rose from 12.2% to 19.9%.
For owners of French bonds, I wonder how tempting it may be to cash in their 0.44% yielding bonds, convert EUR into a very weak Ruble to Buy 20% yielding government bonds.
While the French rely on Russian nuclear fuel to power the nuclear power stations which generates 70% of their electricity, the analysis is will the Russian Government be creditworthy to pay back that bond and not default.
The larger advancers over the past week comprised of;
“Russia produces about 35% of the world’s enriched uranium for reactors, about twice as much as the No. 2 provider, and supplies about 20% of the U.S. industry.”
In dollar terms, South Korea, France, China, Sweden and the United Kingdom are amongst the larger importers of U-235 enriched uranium plutonium compounds.
France derives 70% of its electricity via nuclear power.
Can you see why Macron is ‘staying in touch’ with Putin prior and during the Russian/Ukraine war?
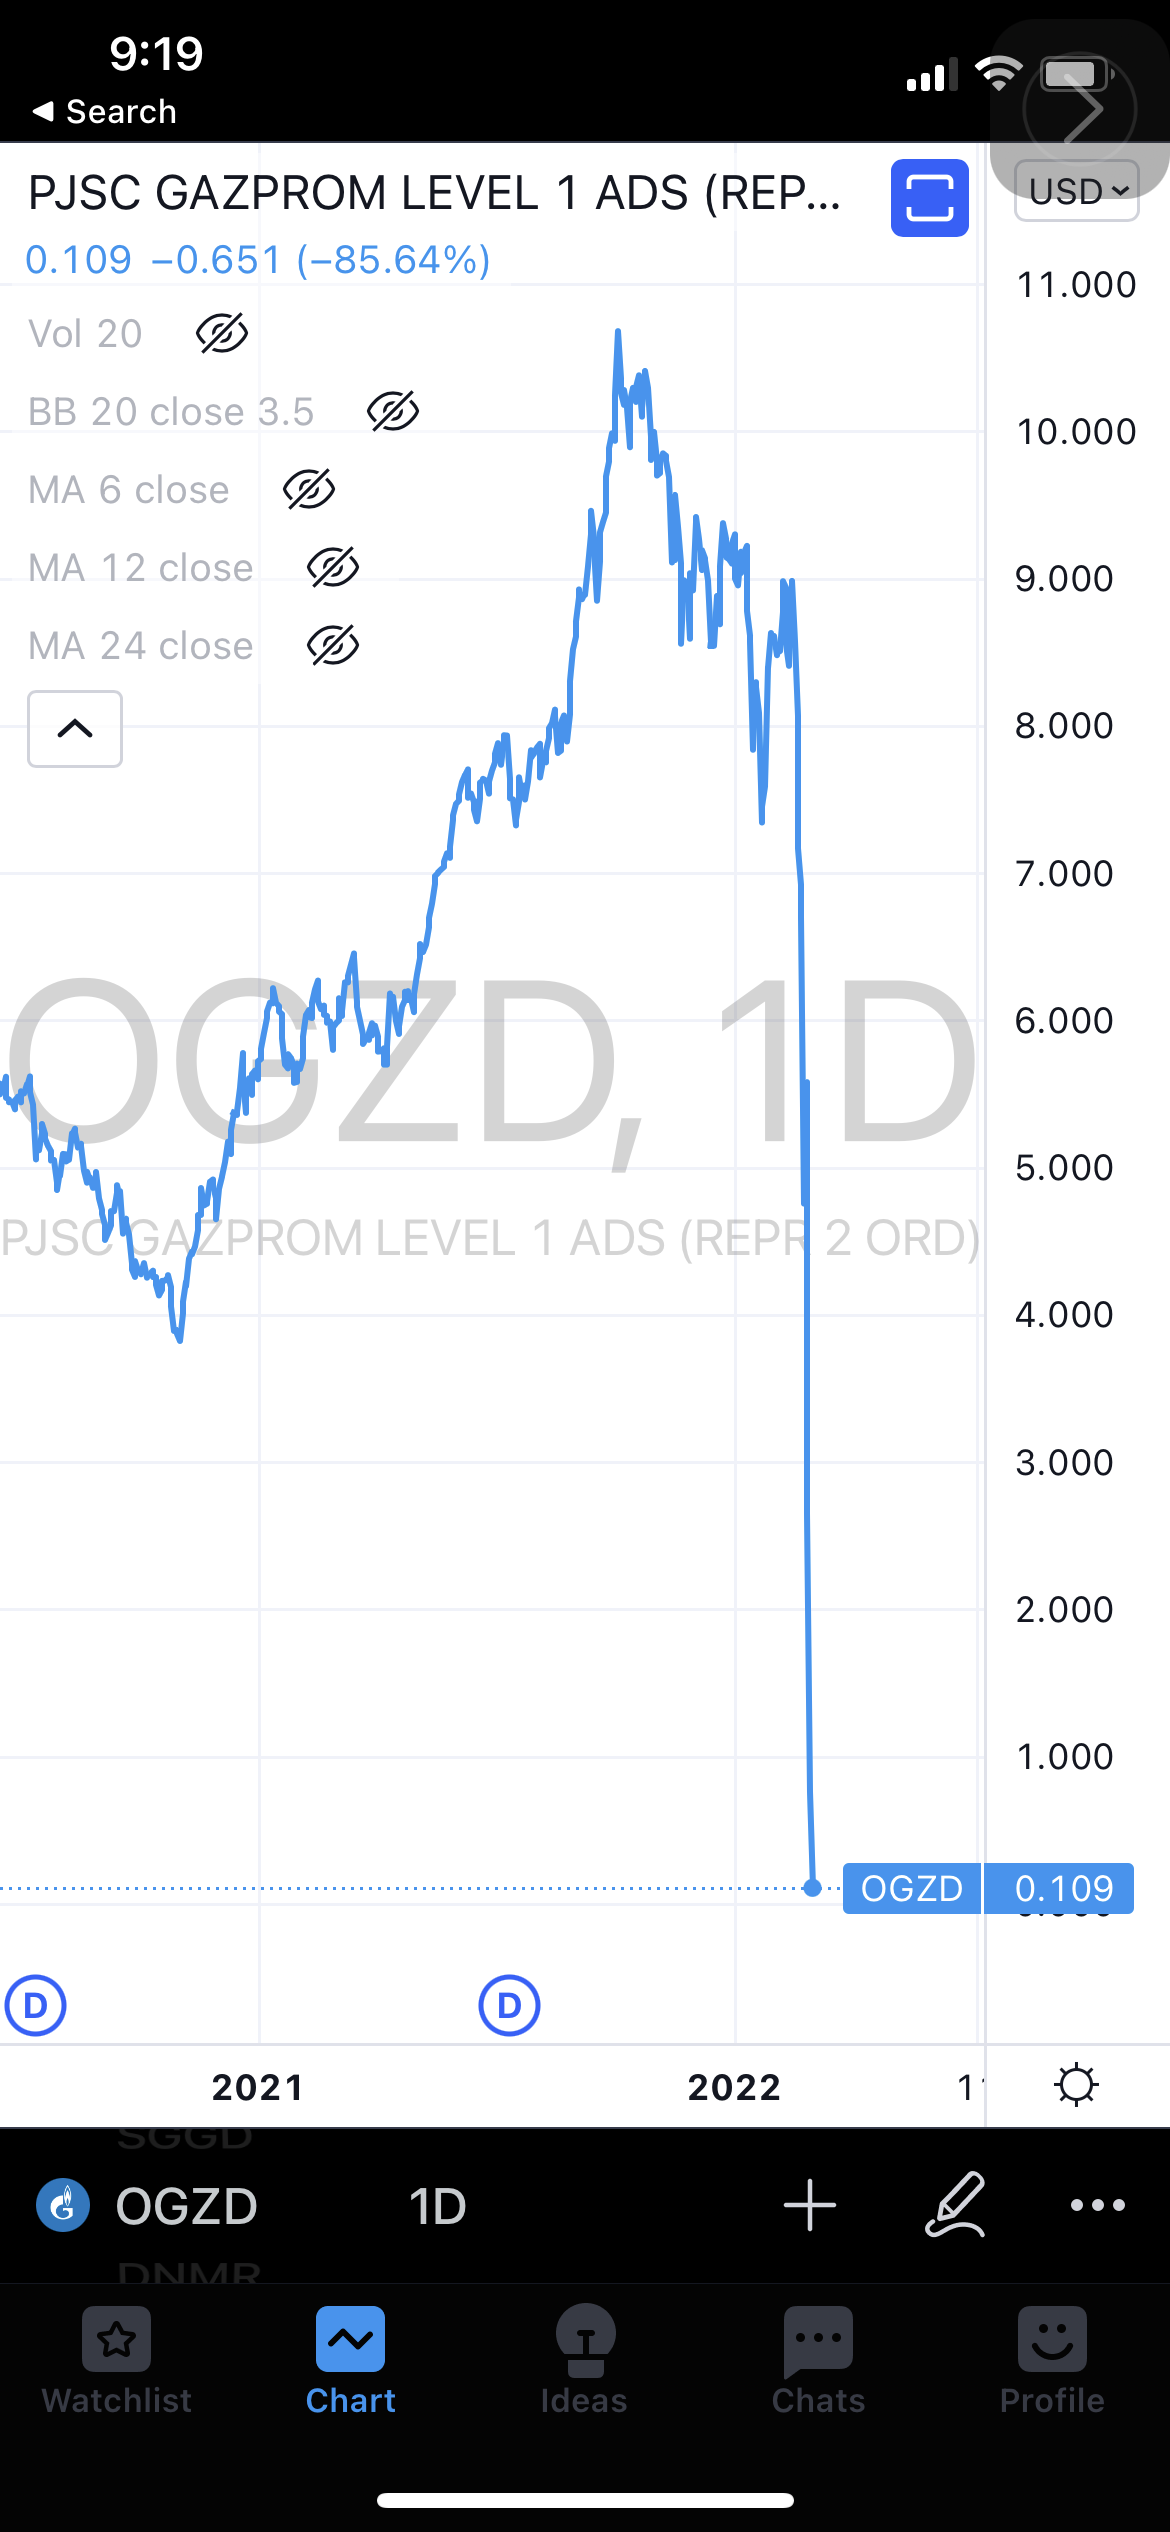
The market cap destruction of Russian equities is one of the most amazing things I’ve seen in capital markets.
Gazprom’s market cap 2 months ago was $65 billion.
This a screenshot from my phone last night, while trading was happening in Gazprom’s London listed GDR equities.
Last night’s low was 2 cents per share (from US$9.00).
It’s market cap was $250 million.
Trading was halted more than 15 times in the first couple hours during Wednesday’s trade.
The stock closed at 60 cents.
An asymmetric trade
The mind boggles as to the money lost and the speculators (market makers) who made 20 times return, from the low by the end of the close of the day’s trading.
So, let say $1 million was outlaid (which is just as you’d own 0.5% of all of Gazprom) and the asymmetric bet was…buying at 3 or 5 cents means that this stock EITHER goes to Zero (so you lose $1 million) OR it works its way back to $2 (not $5 nor $9), thus making you $40 million.
Easy to say, if you don’t fathom a 100% loss or if the exchange halts trading or your broker no longer allows you to trade the stock or provide custody. (see sizing your bet appropriately)
But, all in 1 day, You are up 12 times….Hmmmm, so what’s next ?
Halve it, Hold, Cut it or something in between?
#asymmetric
* this is a capital markets post, in no way is any humanitarian insensitivity meant.
For those reading/watching my selected stock calls, if you’ve ‘squeezed out’ an extra 10% since I wrote this, Woodside Energy is close to the notable $30.85 resistance.
The following assets (on a weekly timeframe) registered an Overbought reading or traded more than 2.5 standard deviations above its rolling mean.
Extremes “above” the Mean (at least 2.5 standard deviations)
Gold
Lean Hogs
Palladium
Platinum
Corn
Overbought (RSI > 70)
Australian 2, 3 and 5 year government bond yields
U.S 2, 5 & 10 year government bond yields
German 5 year government bond yields
Spanish, French, Greek, Italian, Japanese, Portuguese and New Zealand 10 year government bond yields
CRB Index
Australian Coal
Aluminium
Gasoil
Tin
The Overbought Quinella – Both Overbought and Traded at > 2.5 standard deviations above the weekly mean)
Australian & Russian 10 year government bond yields
Bloomberg Commodity Index
WTI Crude Oil
Brent Crude Oil
Gasoline
Nikkei 225 Index
Assets (securities) which touched the other side of the extreme, being Oversold (where the RSI is < 30) or were at least 2.5 standard deviations below its mean are;
Extremes “below” the Mean (at least 2.5 standard deviations)
Korean Won / USD
AEX, CAC, DAX, DJIA, MIB, IBEX, S&P Midcap 400, Nasdaq 100, Sensex, Copenhagen, Swiss SMI and the S&P 509
Oversold (RSI < 30)
U.S. 10 year minus 2 year government bond yield spread
Hot Rolled Coil Steel (HRC)
Korea’s KOSPI Index
The Oversold Quinella – Both Overbought and Traded at > 2.5 standard deviations above the weekly mean)
Russian Ruble / USD (it weakened 8%)
Notes & Ideas:
This week’s big news was the savage decline (and reversal) in prices due to the initial reaction of Russia attack on Ukraine.
For example, at their highest points Heating Oil, Natural Gas, Crude Oil, Soybeans and Corn rose between 10%-11%.
Wheat advanced 19% at one stage, Dutch TTF Gas soared 80%, Gasoline climbed 15% and Gold rose 4% to only close ‘flat’ on the week.
On the flip side, the U.S. KBW Banking, DAX and CAC were down 7% at their lowest ebb during the week.
Such volatility is not only a test of one’s metal and resolve but is a costly lesson for those ‘whipsawed’ through their stop losses.
I illustrated some of the intra-day moves in this post.
Russian 10 year bond yields move from 9.8% to 12.2% and Turkish 10’s went from 20.8% to 23%.
However, there are some misnomers in the Oversold equity indices readings as they breached their 2.5 standard deviation moves ‘intra-week’ before reversing higher.
Incidentally, the Baltic Dry Index rose 11% on the week. This measure of the cost of shipping dry, bulk goods is up 68% since my ‘bottom’ call on January 24th.
Since they appeared and were cited in this weekly note a few weeks, Coffee and Orange Juice are down 8% and 13% respectively since they registered Overbought Extremes.
And the ‘surprise’ was the U.S. indices finished in the black for the week.
You can read a note written this week which recalled when U.S. equities rose during the 1991 Iraq aerial attack and how equities rose throughout those 32 days.
I needed to make a note of yesterday’s volatility in Russian equities.
Lukoil fell 57% at one stage to close ‘only’ down 22% on the day.
Gazprom’s intraday low was 41% below the previous day’s close.
After all of that, it closed down 29%.
Sberbank was down 57% at one stage yet closed a respectable negative 37% while TCS Group (a financial services firm) tanked 80% and then rallied to close down 59%.
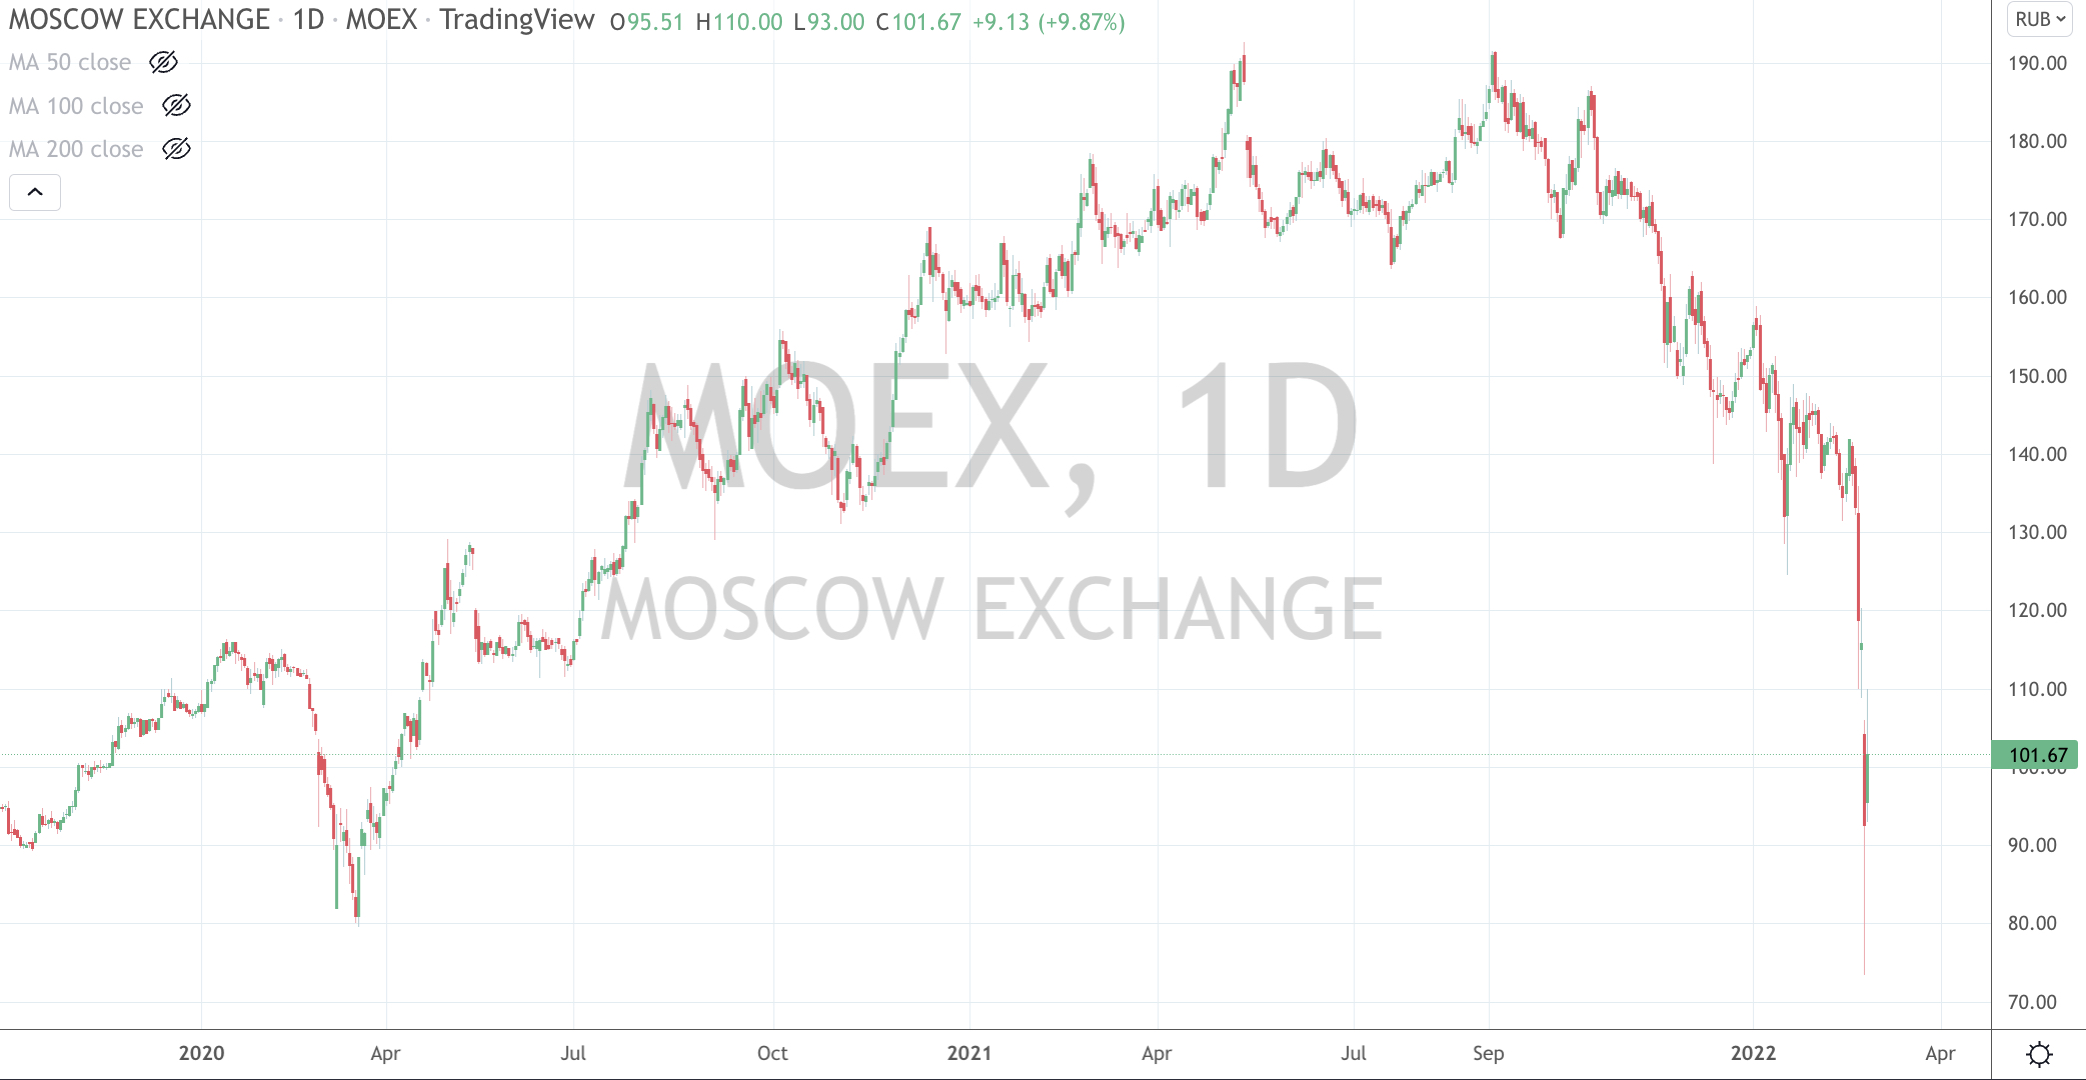
and the whole index (the MOEX) was down 51% at its lowest point and closed down 33% on the day.
It is extraordinary that a whole index halved in value.
It may be an immediate signal that sanctions had an effect.
Rarer still, some of these moves were 4 standard deviations below their weekly mean.
In this morning’s trading session, these stocks are +10%, (4%), (4%) and +33% respectively, while the MOEX has bounced a further 6%, albeit it seems unconvincing.