The following assets (on a weekly timeframe) registered an Overbought or Oversold reading and/or have traded more than 2.5 standard deviations above or below its rolling mean.
Extremes “above” the Mean (at least 2.5 standard deviations)
Istanbul’s BIST Index
Overbought (RSI > 70)
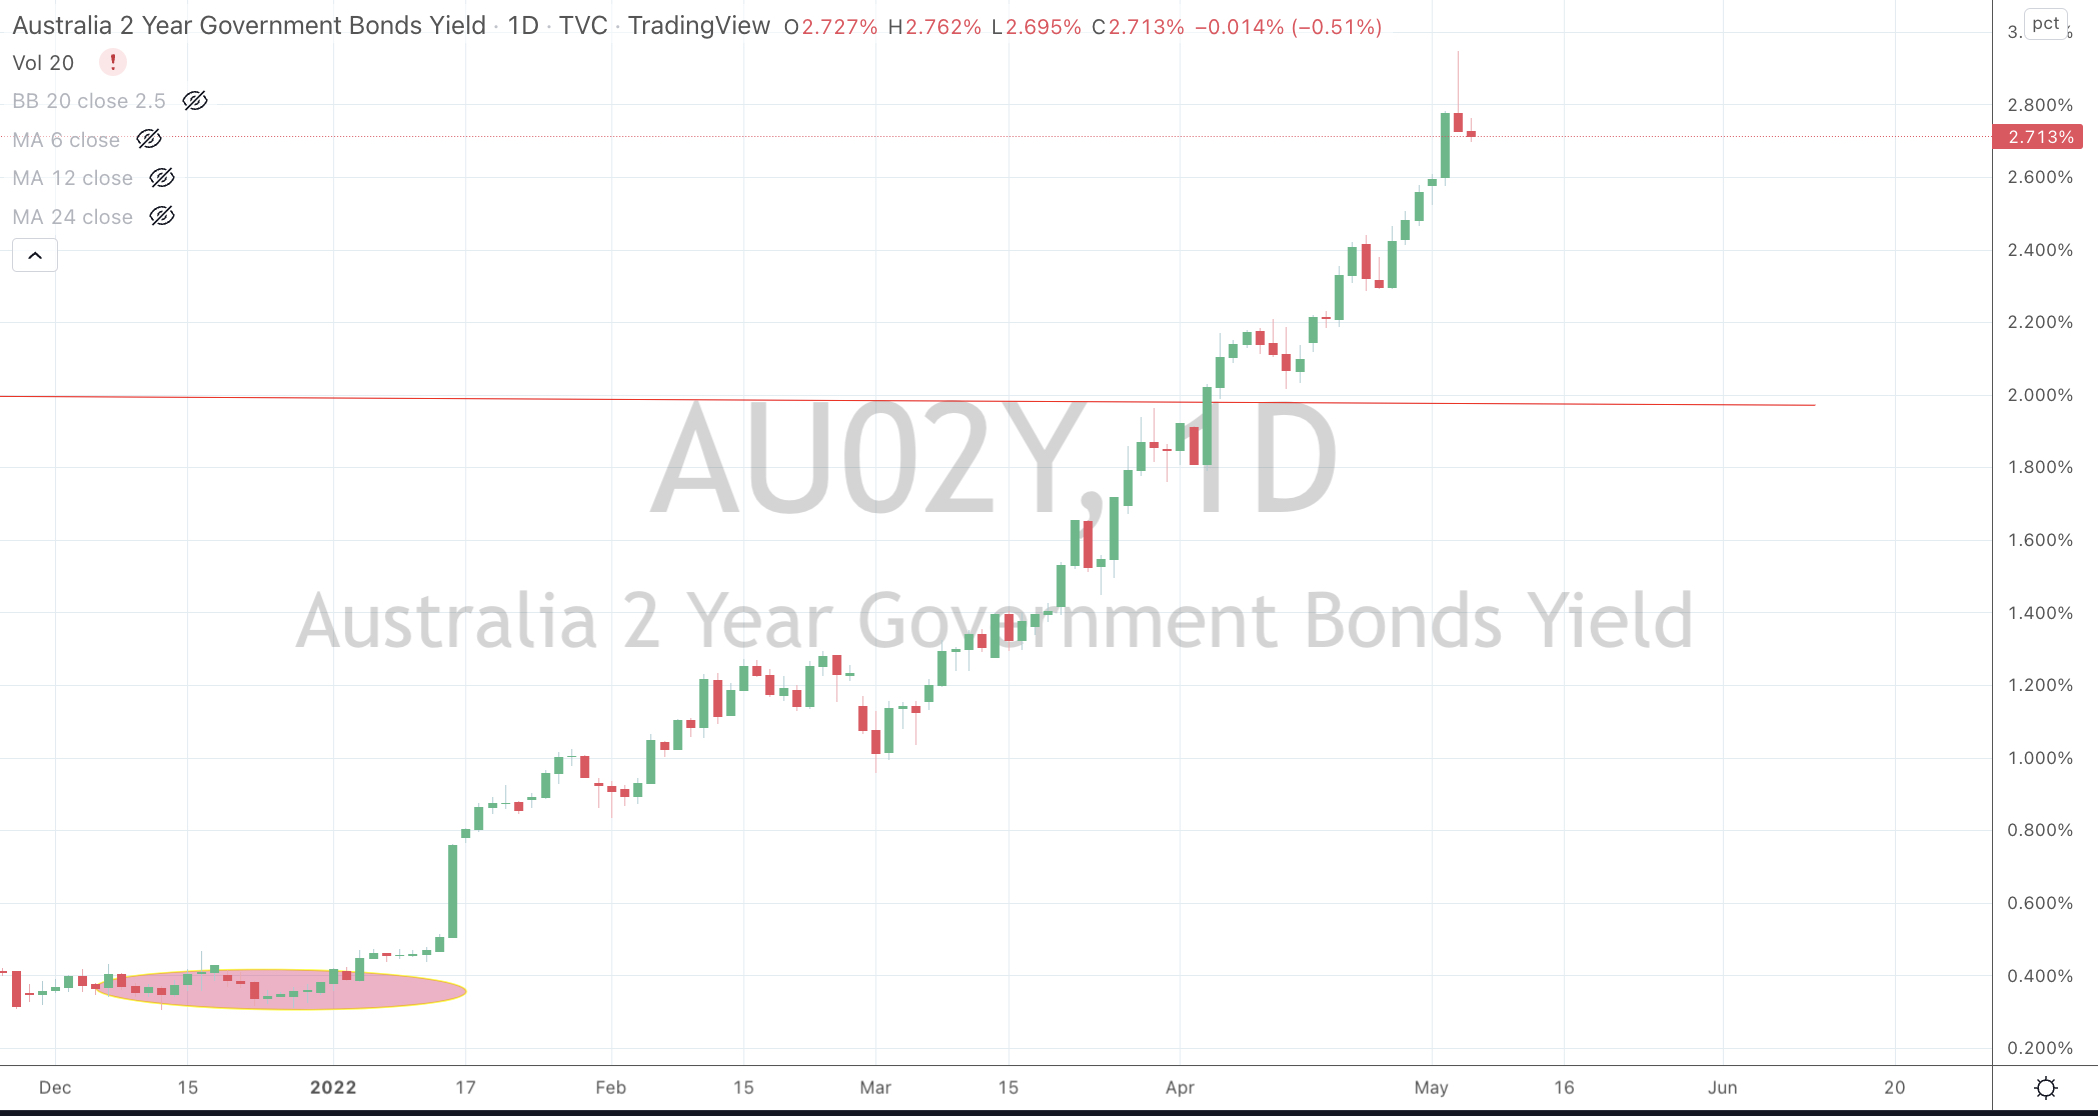
Australian 2, 3, 5 & 10 year government bond yields
Canadian, Spanish, French, Greek, British, Italian, Korean, Swedish, Portuguese, New Zealand & Swiss 10 year government bond yields
German 2, 5 and 10 year yields
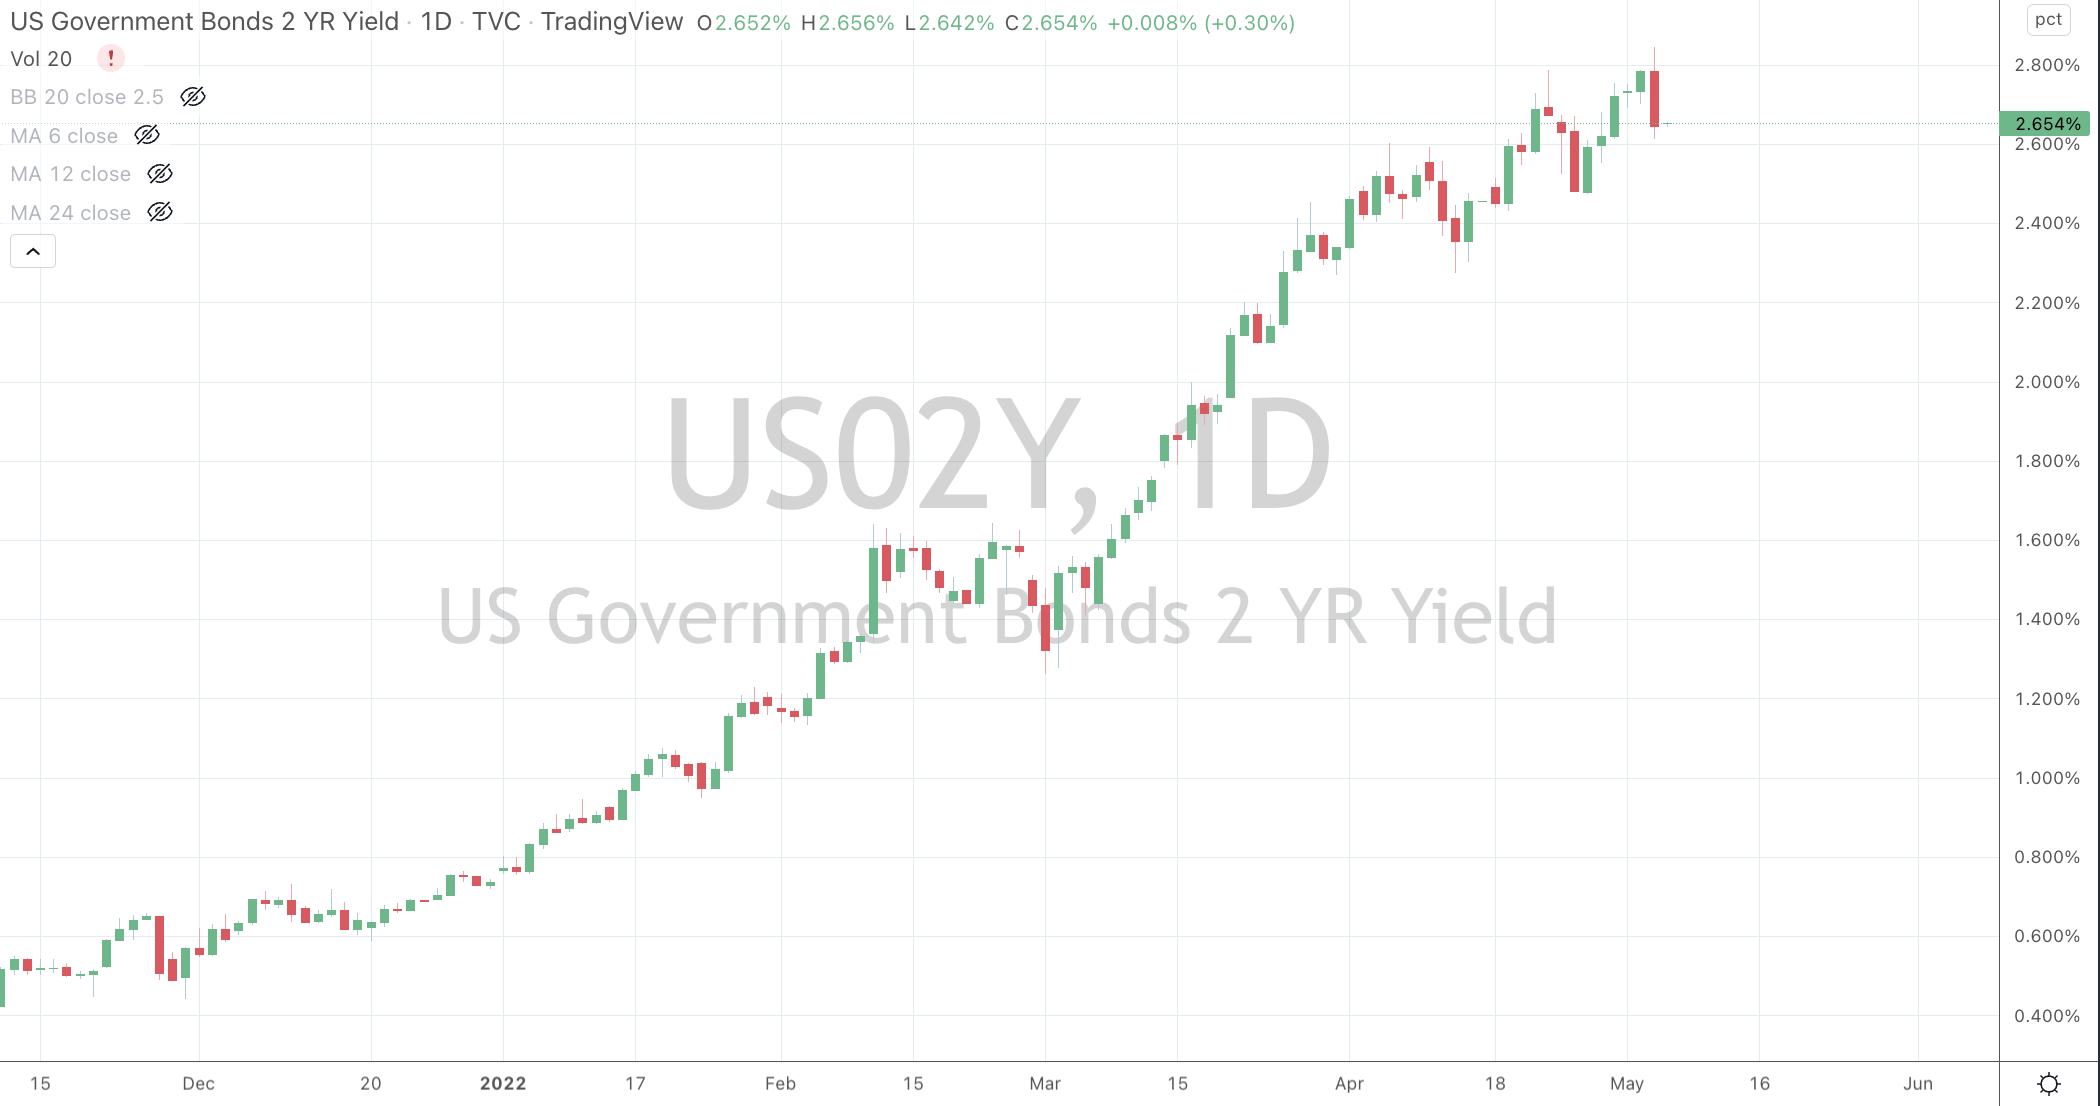
U.S. 2, 5 & 10 year yields
TBX & TBT
CRB (Commodities) Index
Corn
Rice
Cotton
Orange Juice
AUD/JPY
The Overbought Quinella – Both Overbought and Traded at > 2.5 standard deviations above the weekly mean)
U.S. Dollar Index (DXY)
Heating Oil
USD/JPY
Extremes “below” the Mean (at least 2.5 standard deviations)
Cattle
NZD/USD
SGD/USD
Taiwan’s Taiex index
Oversold (RSI < 30)
TLT
IEF
China’s CSI 300
JPY/AUD
HKD/USD
The Oversold Quinella – Both Overbought and Traded at > 2.5 standard deviations above the weekly mean)
FXE
GBP/USD
EUR/USD
CNH/USD
KRW/USD
Shanghai Composite
Notes & Ideas:
This past week’s big news remains the same. Bonds and Currencies.
Other observations include;
UK Gilts aren’t overbought anymore,
Bitcoin has broken a support line,
The Copper/Gold Ratio closed the week (it’s lowest weekly close since January 24th) at an important support line. (In Monday’s trade, it has broken below this),
The Japan/Korean LNG Marker is at its lowest price since February 14th,
We saw a bearish outside reversal week in the AUD/GBP,
The Euro has reached its most oversold level (on a monthly basis, not my usual weekly timeframe) since 2015,
The AUD/JPY is not overbought anymore,
while the AUD/USD flaunting is support line,
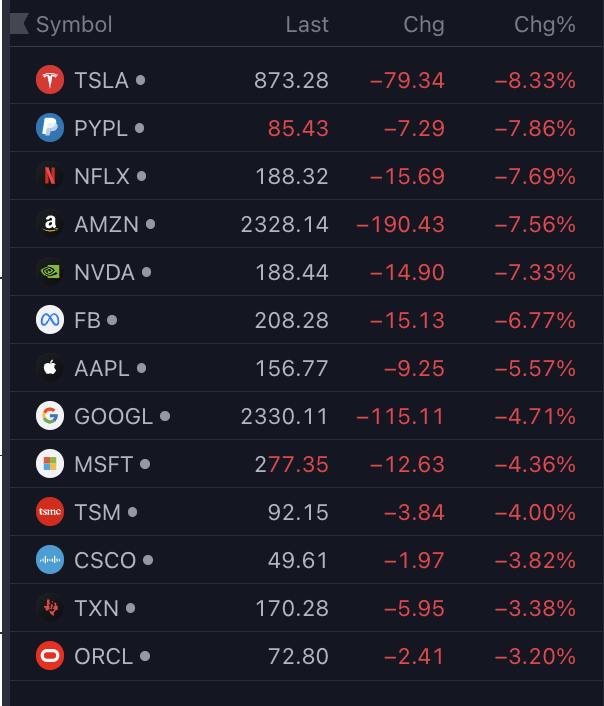
The mean reversion of those FAANGM’s has reached halftime.
There are places to hide, the CAC only fell 0.7% for the week, Italy’s MIB and Singapore’s Strait Times Index declined a mere 0.1%, the Nikkei was down 0.9% and the ASX 200 barely eased 0.5%,
A 13.3% swoon in the Nasdaq 100 over the past 4 weeks and it’s still not oversold.
Natural Gas recovered last week’s decline of 11%,
the price of Urea slumped 19%
and Precious Metals fell while major equities indices did the same. Last week’s edition of ‘Macro Extremes’ signalled this citing their bearish outside reversal price action.
The larger advancers over the past week comprised of;
Baltic Dry Index 4.2% (adding to last week’s 8% rise), Heating Oil 21.4%, Australian Coal 11.4%, WTI Crude Oil 2.6%, U.S. Dollar Index 2.1%, Gasoil 9.7%, Gold Volatility Index 4.5%, Natural Gas 10.9%, Orange Juice 2.5%, Gasoline 4.2%, Cotton 7.2%, Dutch TTF Gas 4.8%, Corn 2.6%, Rice 5.6%, HSCEI 4.7%, Hang Seng 9.5%, Russia’s MOEX 9.5%.
The group of decliners included;
Aluminium (4.8%), Rotterdam Coal (20.4%), Lean Hogs (9.8%), Copper (3.8%), Hot Rolled Coil Steel (4.4%), JKM (3.8%), Coffee (2.2%), Lumber (2.2%), Cattle (6.9%), Tin (6.3%), Palladium (2.9%), Silver (4.9%), Urea (19.1%), Uranium (2.1%), Gold in USD (1.8%), Oats (9.5%), Wheat (1.8%), Bitcoin (3.8%), KBW Banking Index (5.2%), Dow Jones Industrials (2.5%), Bovespa (2.9%), S&P Midcap 400 (3.2%), Nasdaq (3.8%), Oslo (1.9%), Russell 2000 (4%), SOX (2.3%), S&P 500 (3.3%) and the Taiex fell 2.5%.
May 2, 2022
(written 2 days later than usual, better late than never)
by Rob Zdravevski
rob@karriasset.com.au