The following assets (on a weekly timeframe) registered an Overbought or Oversold reading and/or have traded more than 2.5 standard deviations above or below its rolling mean.
Extremes “above” the Mean (at least 2.5 standard deviations)
Dutch TTF Gas
Overbought (RSI > 70)
Canadian 10 year government bond yield
U.S. 2 year government bond yields
U.S. Dollar Index
Istanbul’s BIST Index
The Overbought Quinella – Both Overbought and Traded at > 2.5 standard deviations above the weekly mean)
None
Extremes “below” the Mean (at least 2.5 standard deviations)
Copper/Gold Ratio
Bloomberg Commodity Index
Gold
Corn
Oats
Soybeans
Wheat
Germany’s DAX Index
Oversold (RSI < 30)
Hot Rolled Coiled Steel
Tin
EUR/USD
GBP/USD
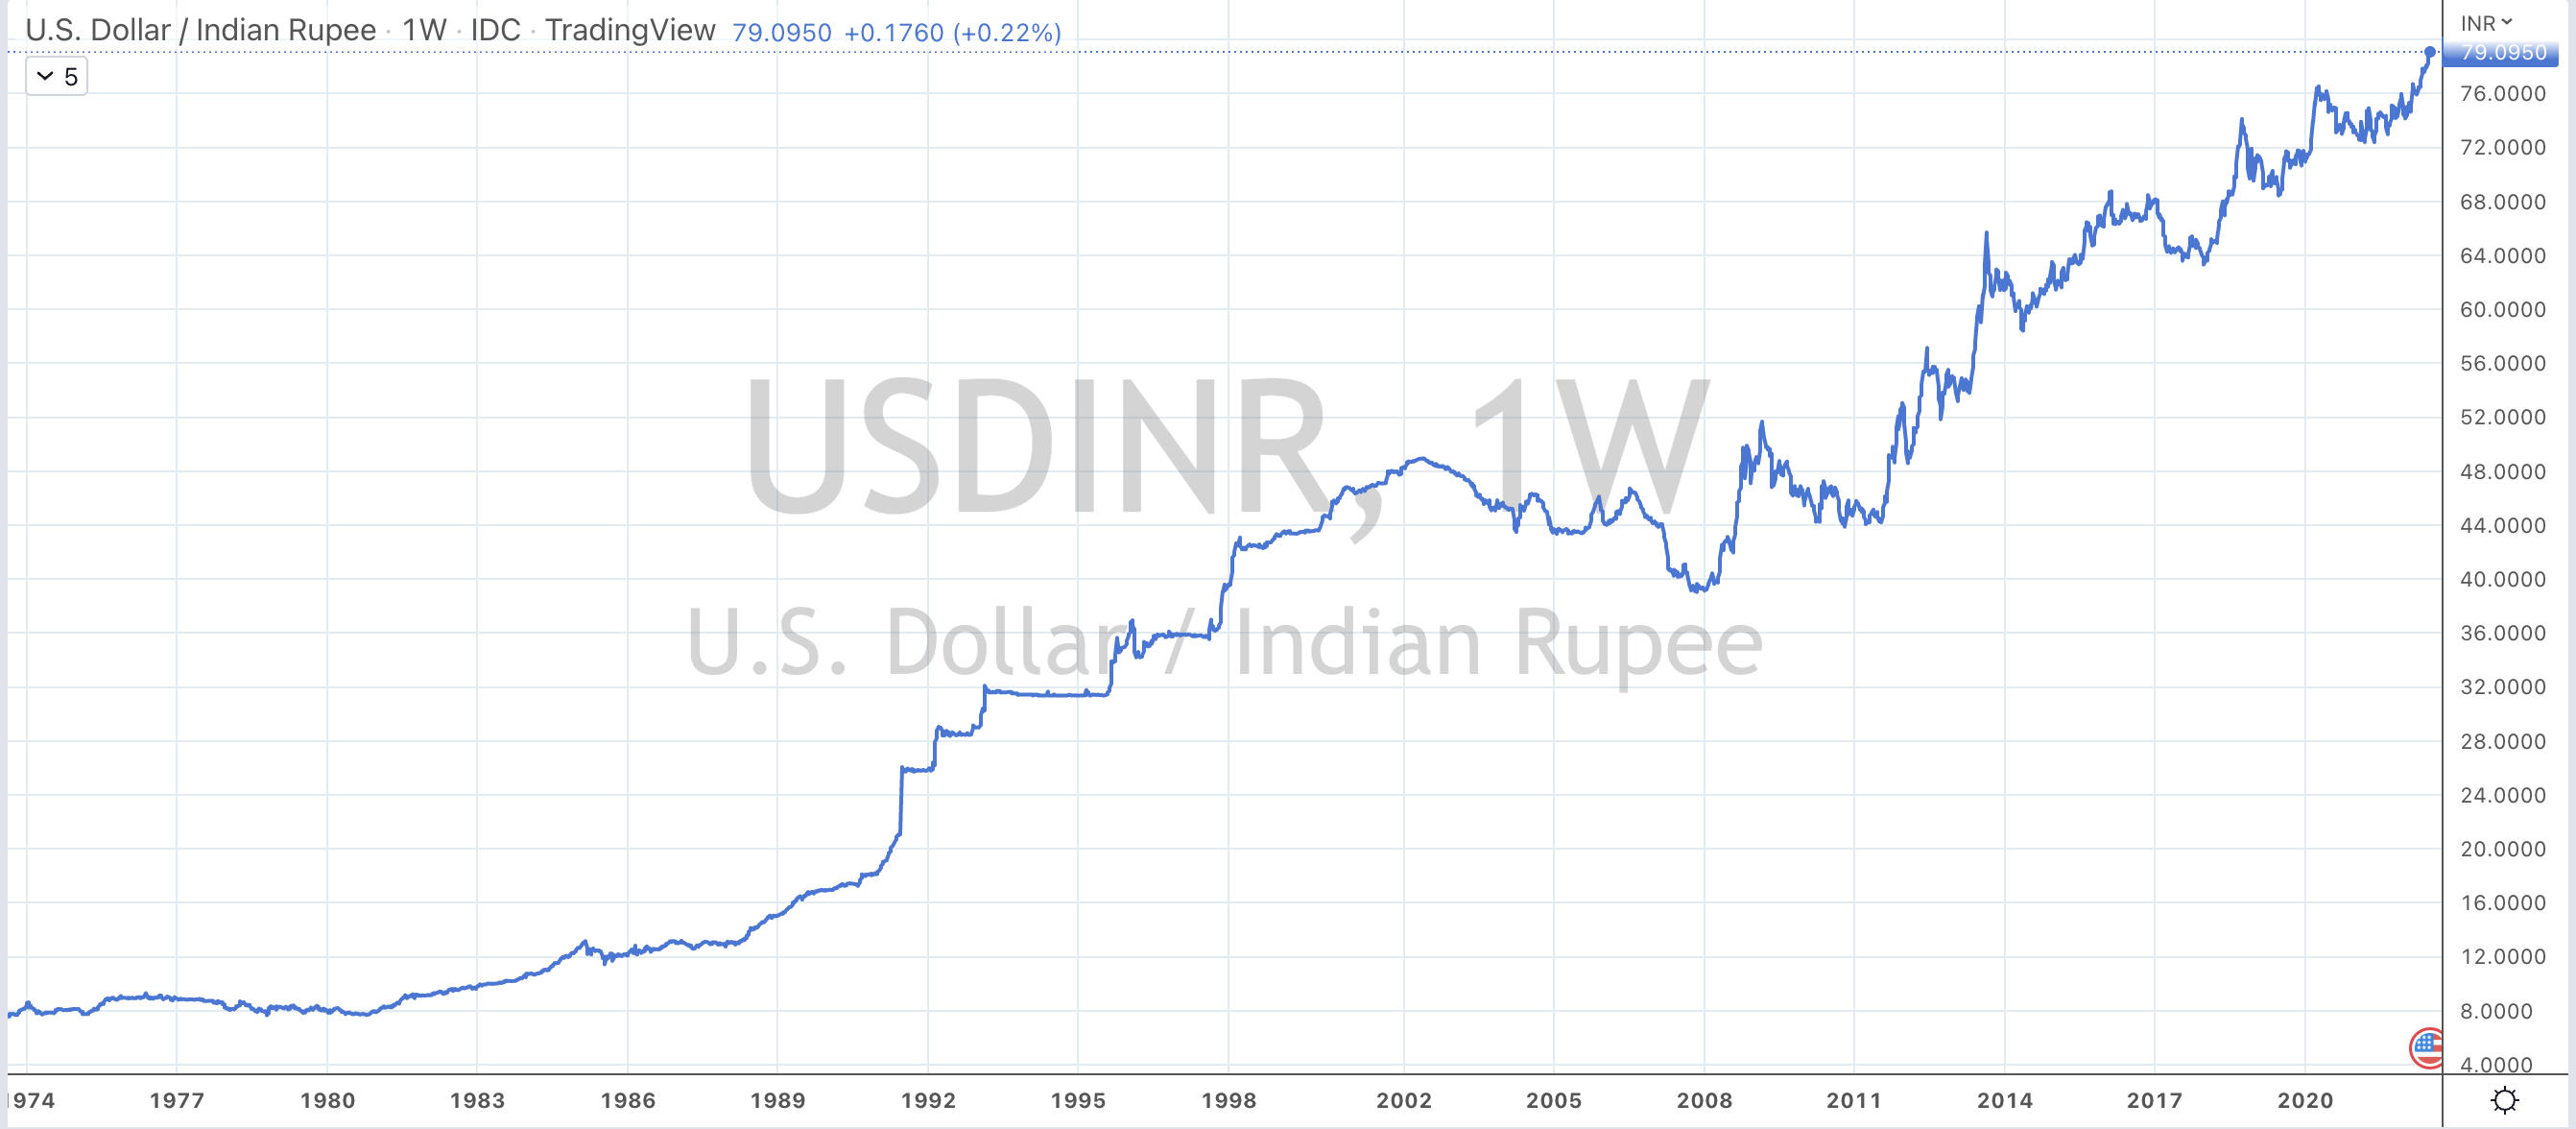
INR/USD
JPY/USD (for the 17th consecutive week)
TRY/USD
IDR/USD
The Oversold Quinella – Both Overbought and Traded at > 2.5 standard deviations above the weekly mean)
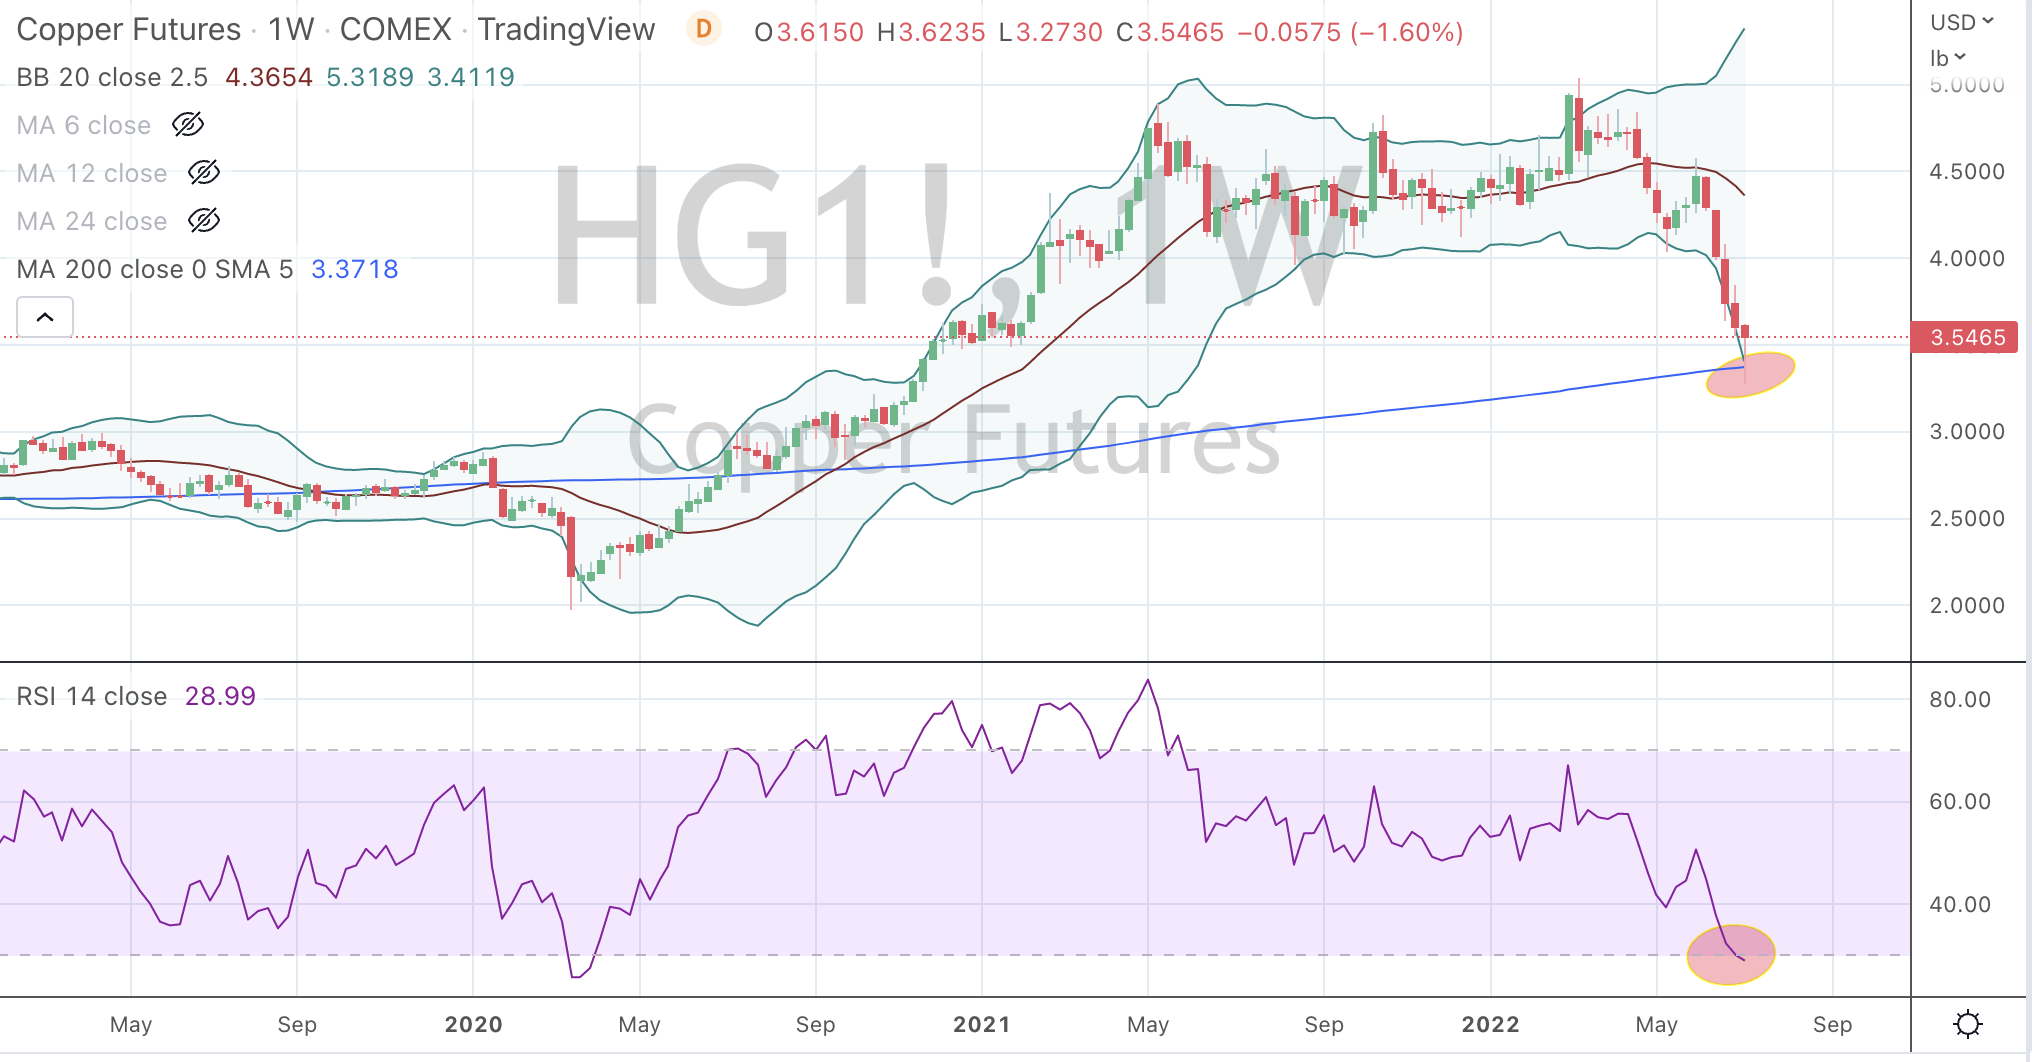
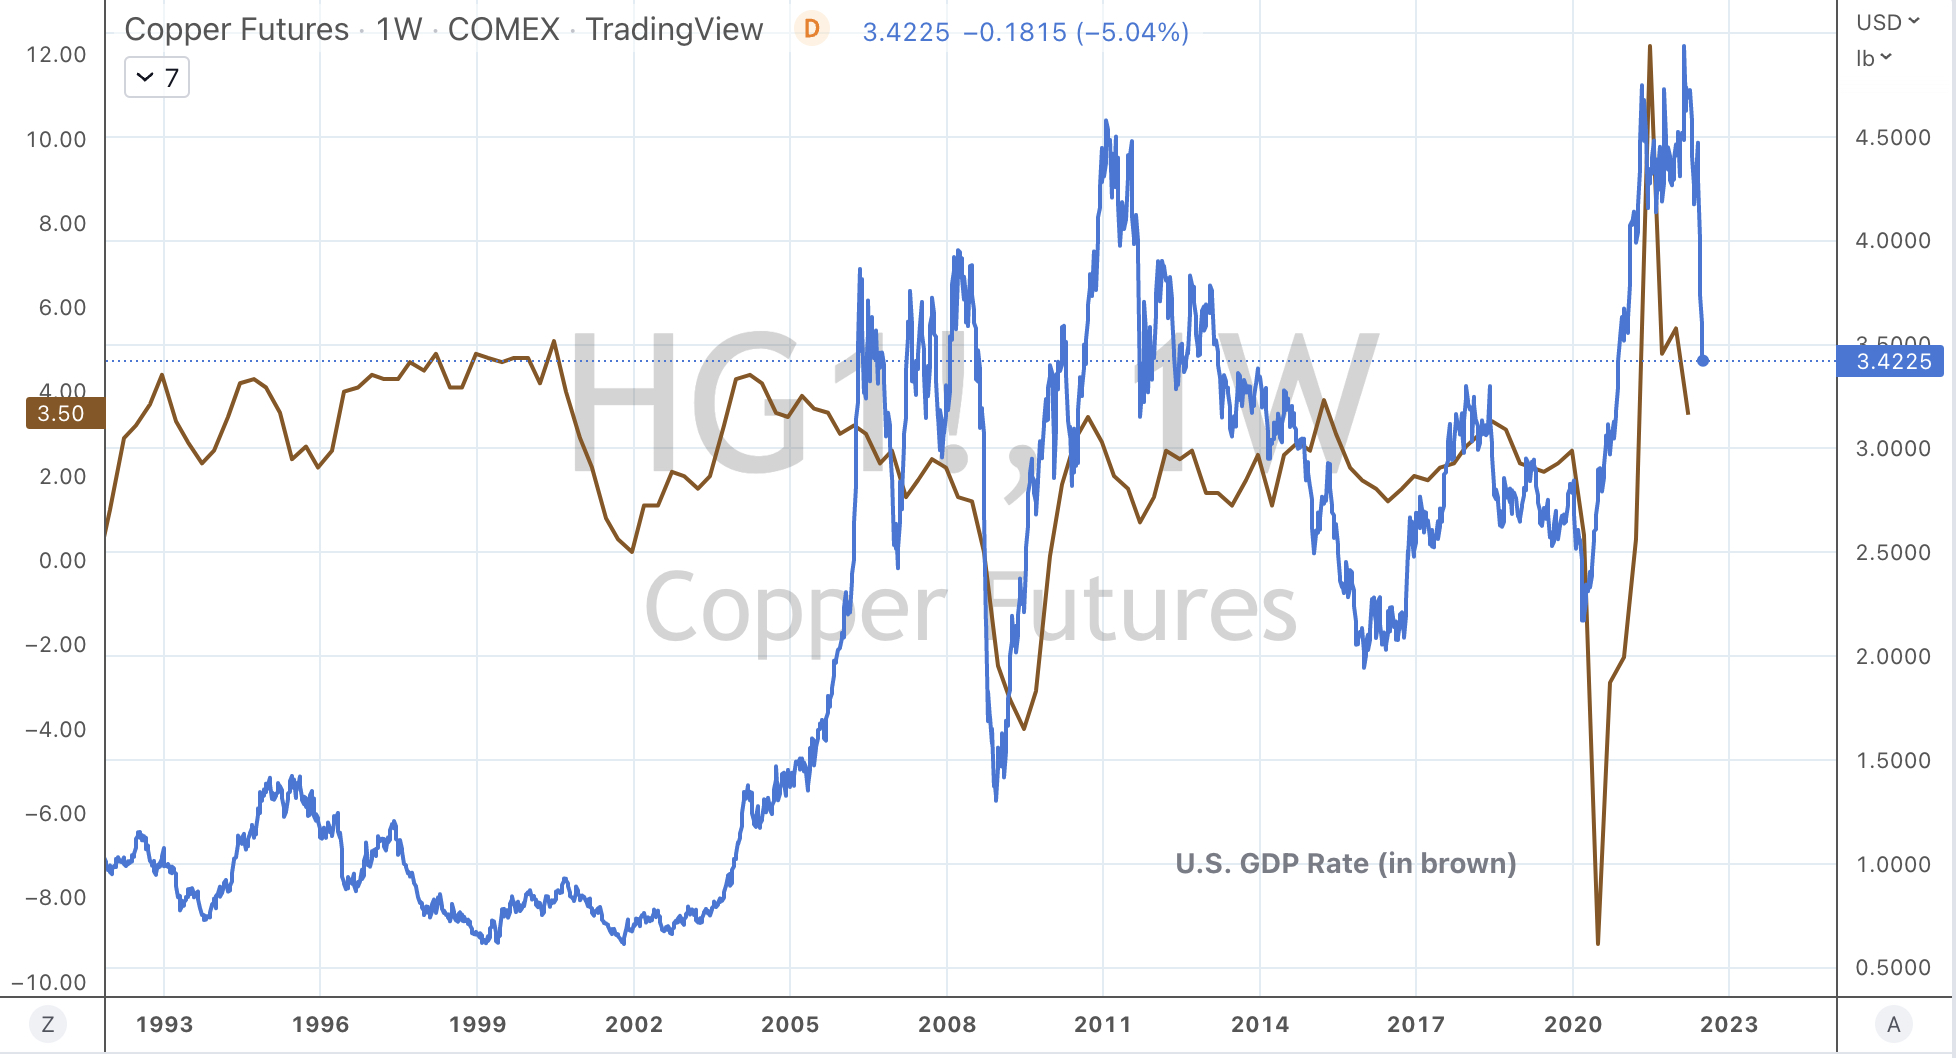
Copper (and 200 WMA)
South Korea’s KOSPI equity index
Taiwan’s TAEIX equity index
Chilean Peso / U.S. Dollar (3rd consecutive week)
DKK/USD
SEK.USD
Notes & Ideas:
This week’s biggest news was pullback in selected commodity prices and the advance in many developed market equity indices.
In an earlier post, I question ‘what if the lows have already been seen”?
In other news, it was a busy week for currencies,
The Euro made new lows.
The Korean Won is not oversold this week.
The AUD/USD made a lower low and its something to watch. Last week’s Macro Extremes talked about a break below 0.6830 opens up probability to wards 0.6570.
The Russian Ruble rose 28% for the week against the U.S. Dollar.
The South African Rand continues its weakness and is nearing a Weekly Oversold reading.
The Danish Krone is cheap, but I’d like to see the OMXC25 (Copenhagen) Index fall a further 12% and then I’ll look at Carlsberg, Vestas Wind Systems or Maersk.
The U.S. yield curve inverted again…..more on that in a seperate note.
Some of the stubborn ‘hold-outs’ in the energy complex fell for the week except for those which have been bludgeoned lately such the Natural Gas price, which following a 4% dip on Friday alone, still managed to produce a weekly gain of 5%….albeit recovering part of last week’s 8% fall.
And the Dutch TTF Gas price rose 19% for the week, as the market is watching if Russia proceeds with its 10 day closure of the NordStream 1 Pipeline, commencing Monday July 11, 2022.
Incidentally, Dutch TTF has soared 86% over the past 4 weeks.
While Lumber rose 5% adding to the previous week gain of 15%. I’ll wait for a lower price, is in the meantime, it can go without me.
Over the past 2 weeks, Gasoline and Gasoil (diesel) has fallen 13%, Heating Oil declined 17%, Australian Coal prices have tanked 35%, the Baltic Dry Index swooned 12% and Tin eased 10%.
The crowd all expect energy prices to rise.
What if they halve as we head into the Northern Hemisphere winter?
I still have a developing view that Coffee will decline notably. It’s fallen 10% since I raised this thought a couple weeks ago and I’m musing that it may ease a further 60%. That will look good for Nestle or Starbucks….
Speaking of predicting declines, the CRB Index has sunk 12% recently and I still think it has 33% more to go, towards its long term mean reversion.
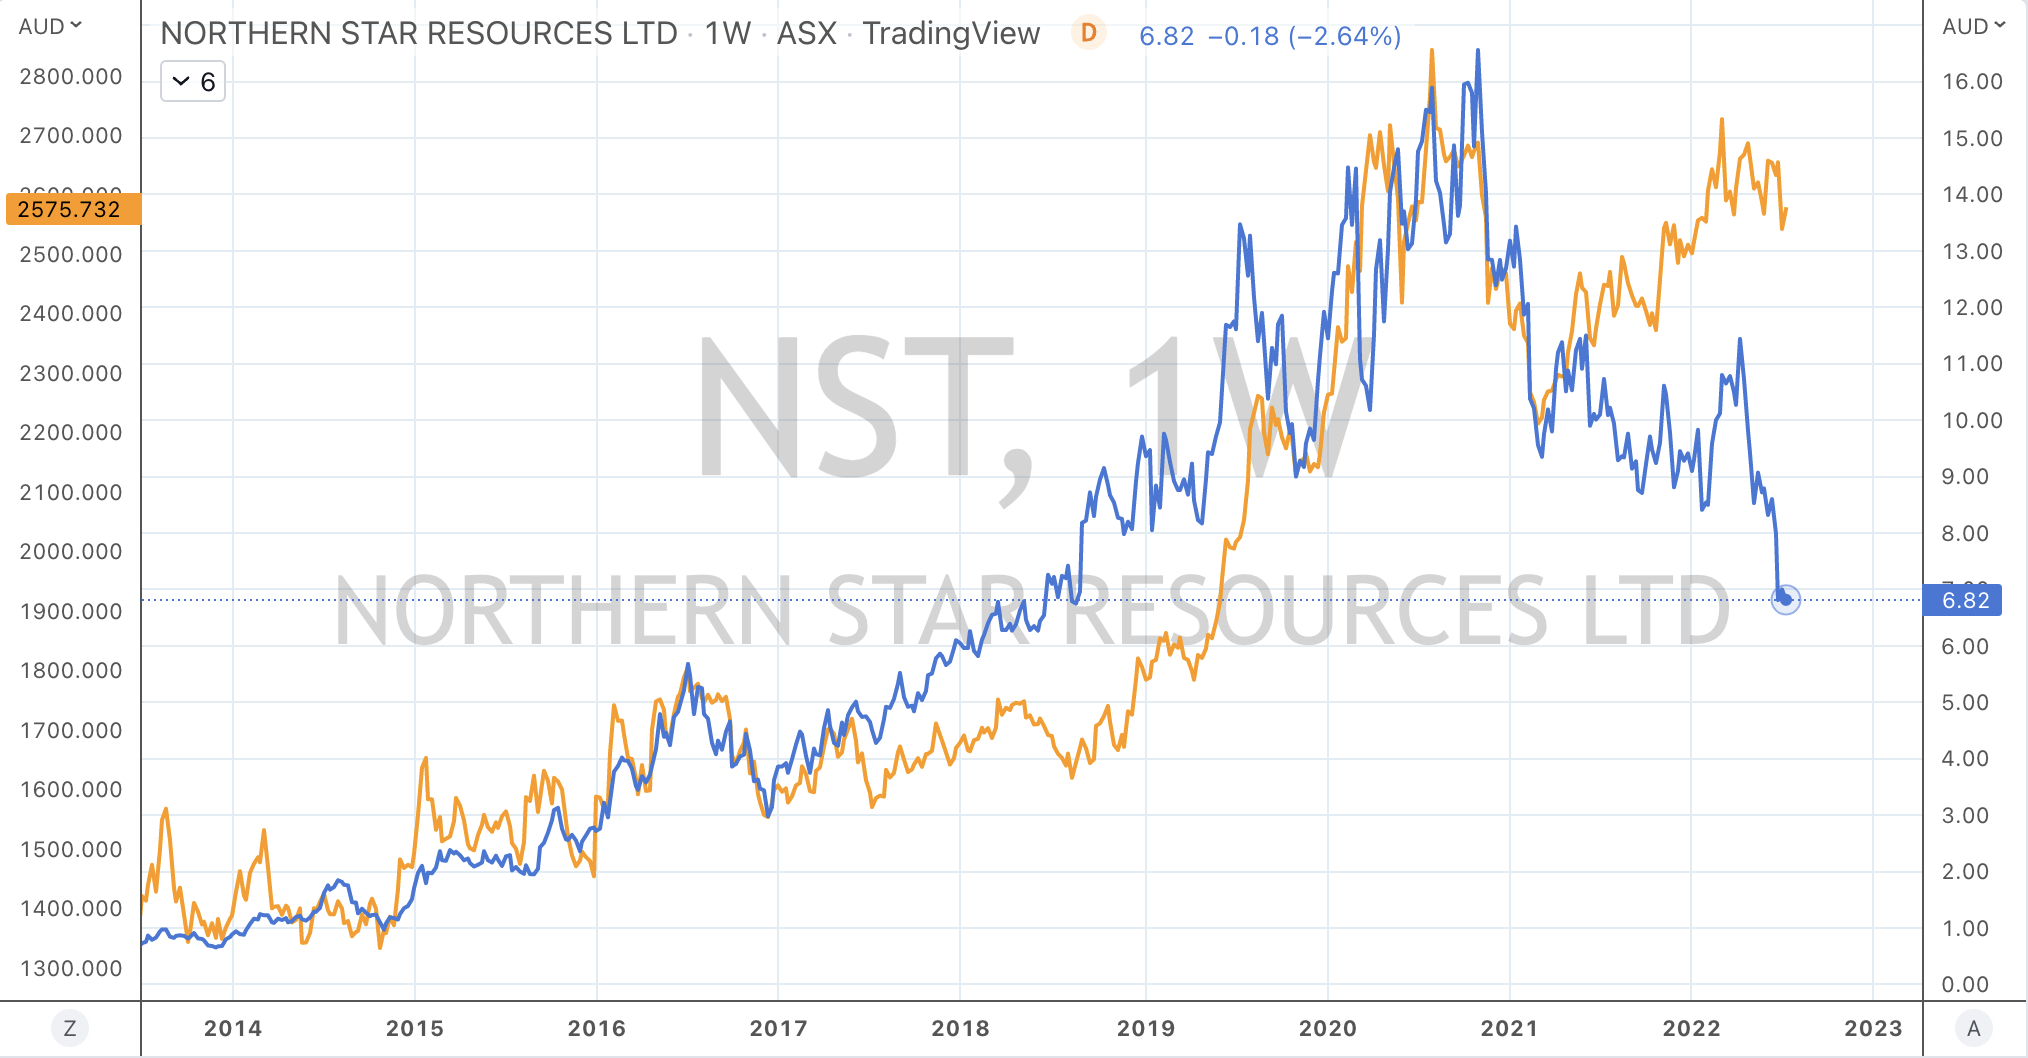
The weakness in Gold and Silver in both USD and AUD was also noticed.
In another set of pondering, what would the consensus view for the commodity cycle look like, should that occur?
Lows are ‘nearly there’ in Australian Coal, Aluminium , Iron Ore prices with the later falling below its 200 week moving average.
In equity indices the Italy’s MIB, Brazil’s Bovespa, the S&P MidCap 400 and S&P 600 SmallCap are also approaching Oversold.
I’m still expecting a ‘double dip’ in some indices but I’m not categorising anything resembling a crescendo or capitulation. It’s just price action.
I’ll watch for a low in the Dow Jones Industrials of 29,440, the DJ transports at 12,130 and the S&P 500 to visit 3,333 – 3,322.
The larger advancers over the past week comprised of;
Rotterdam Coal 5.4%, DXY 1.7%, Hogs 3%, Lumber 5.6%, LNG 6.4%, Natural Gas 5.3%, Palladium 11.3%, Sugar 5.3%, Dutch TTF Gas 18.6%, Corn 22%, Wheat 5.4%, AUD/EUR 3%, AEX 2.8%, CAC 1.7%, DAX 1.6%, MIB 2%, KOSPI 2%, Nasdaq 100 4.7%, Nikkei 2.2%, Sensex 3%, Oslo 2%, Copenhagen 3.3%, Helsinki 2%, Stockholm 5.1%, Russell 2000 2.4%, SMI 2.3%, SOX 6.5%, SPX 2%, ASX 200 2.1%, Biotech Index 5.4%, Nasdaq Composite 4.6%.
The group of decliners included;
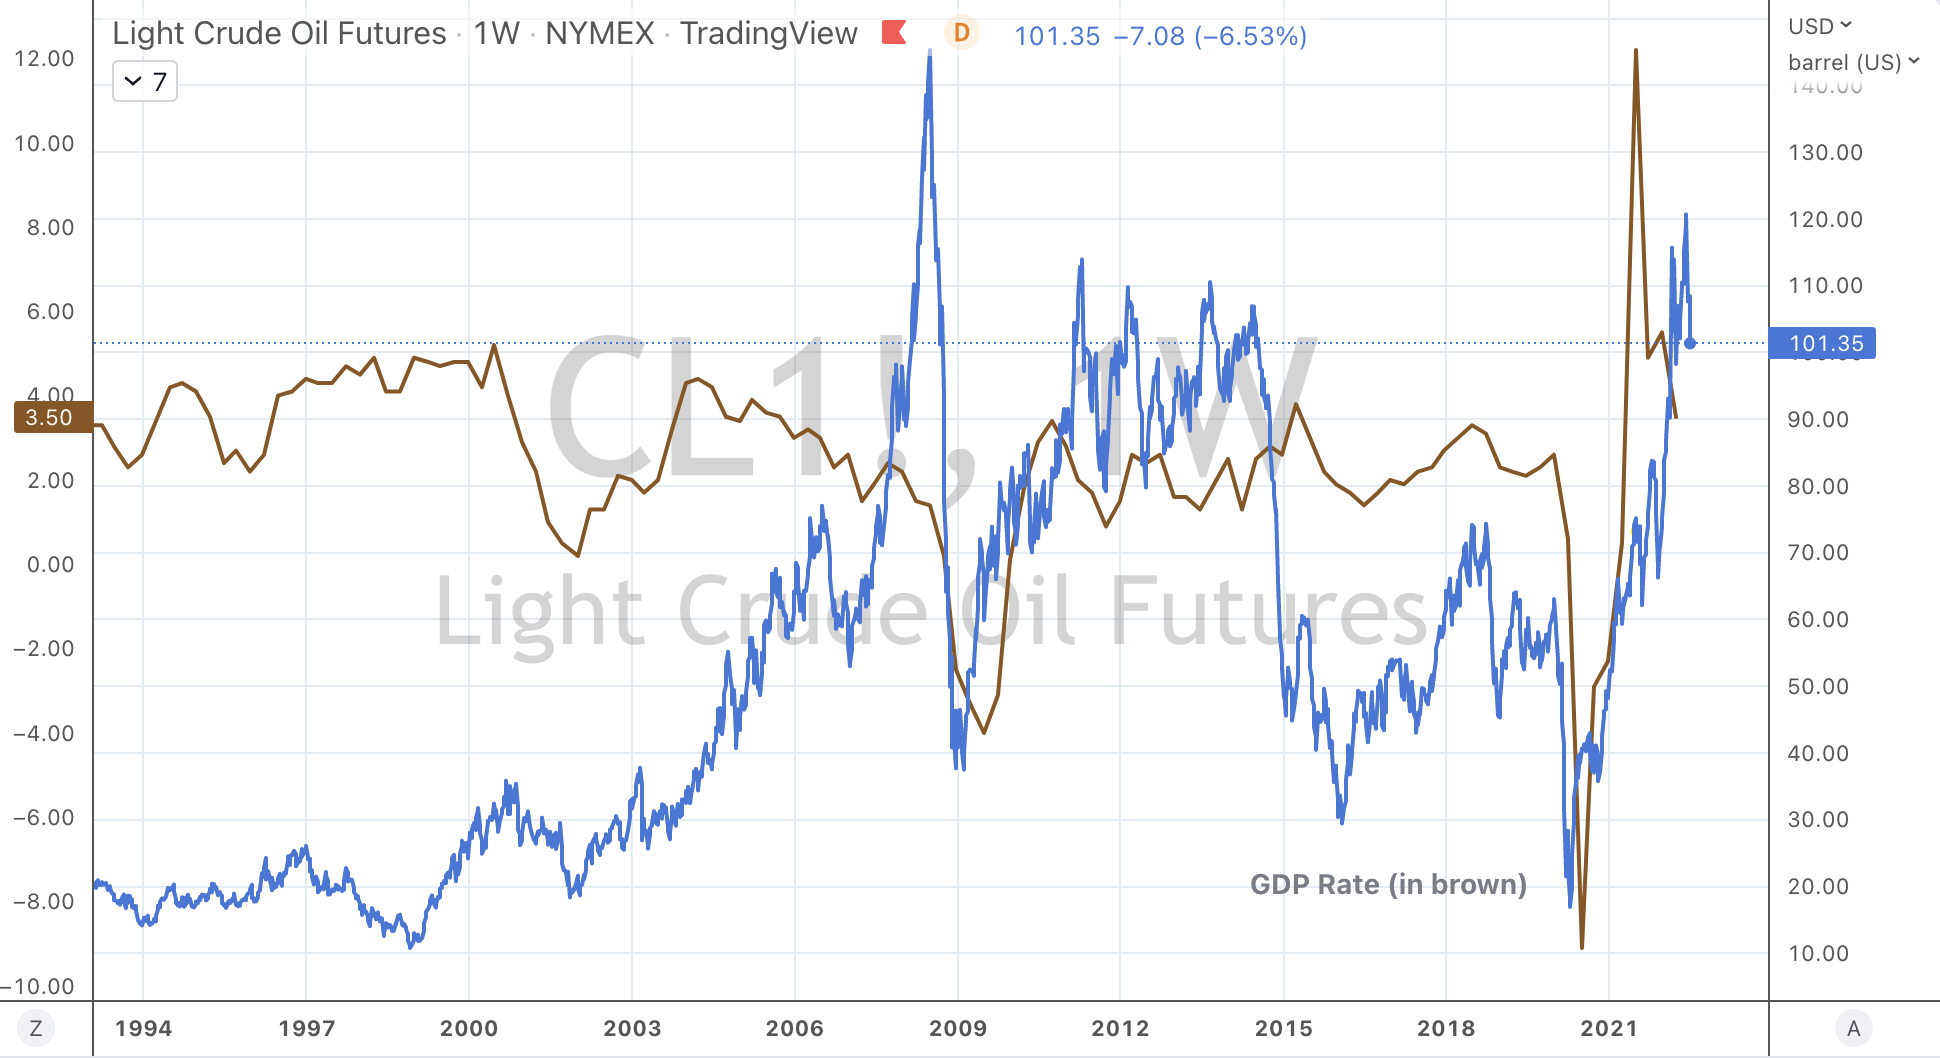
Australian Coal (12.5%), Baltic Dry Index (6.6%), China Coal (2.5%), WTI Crude (3.4%), Gasoil (7.6%), Gold (3.3%), Copper (2.3%), Heating Oil (6.8%), Coffee (1.9%), Tin (3.5%), Orange Juice (3.2%), Gasoline (6.5%), Silver (2.2%), Cotton (2.6%), Brent Crude (3.9%), Uranium (2.8%), Silver AUD (3.3%), Silver USD (2.8%), Gold AUD (4.2%), Gold USD (3.8%), Oats (2.4%0 and EUR/USD (2.4%).
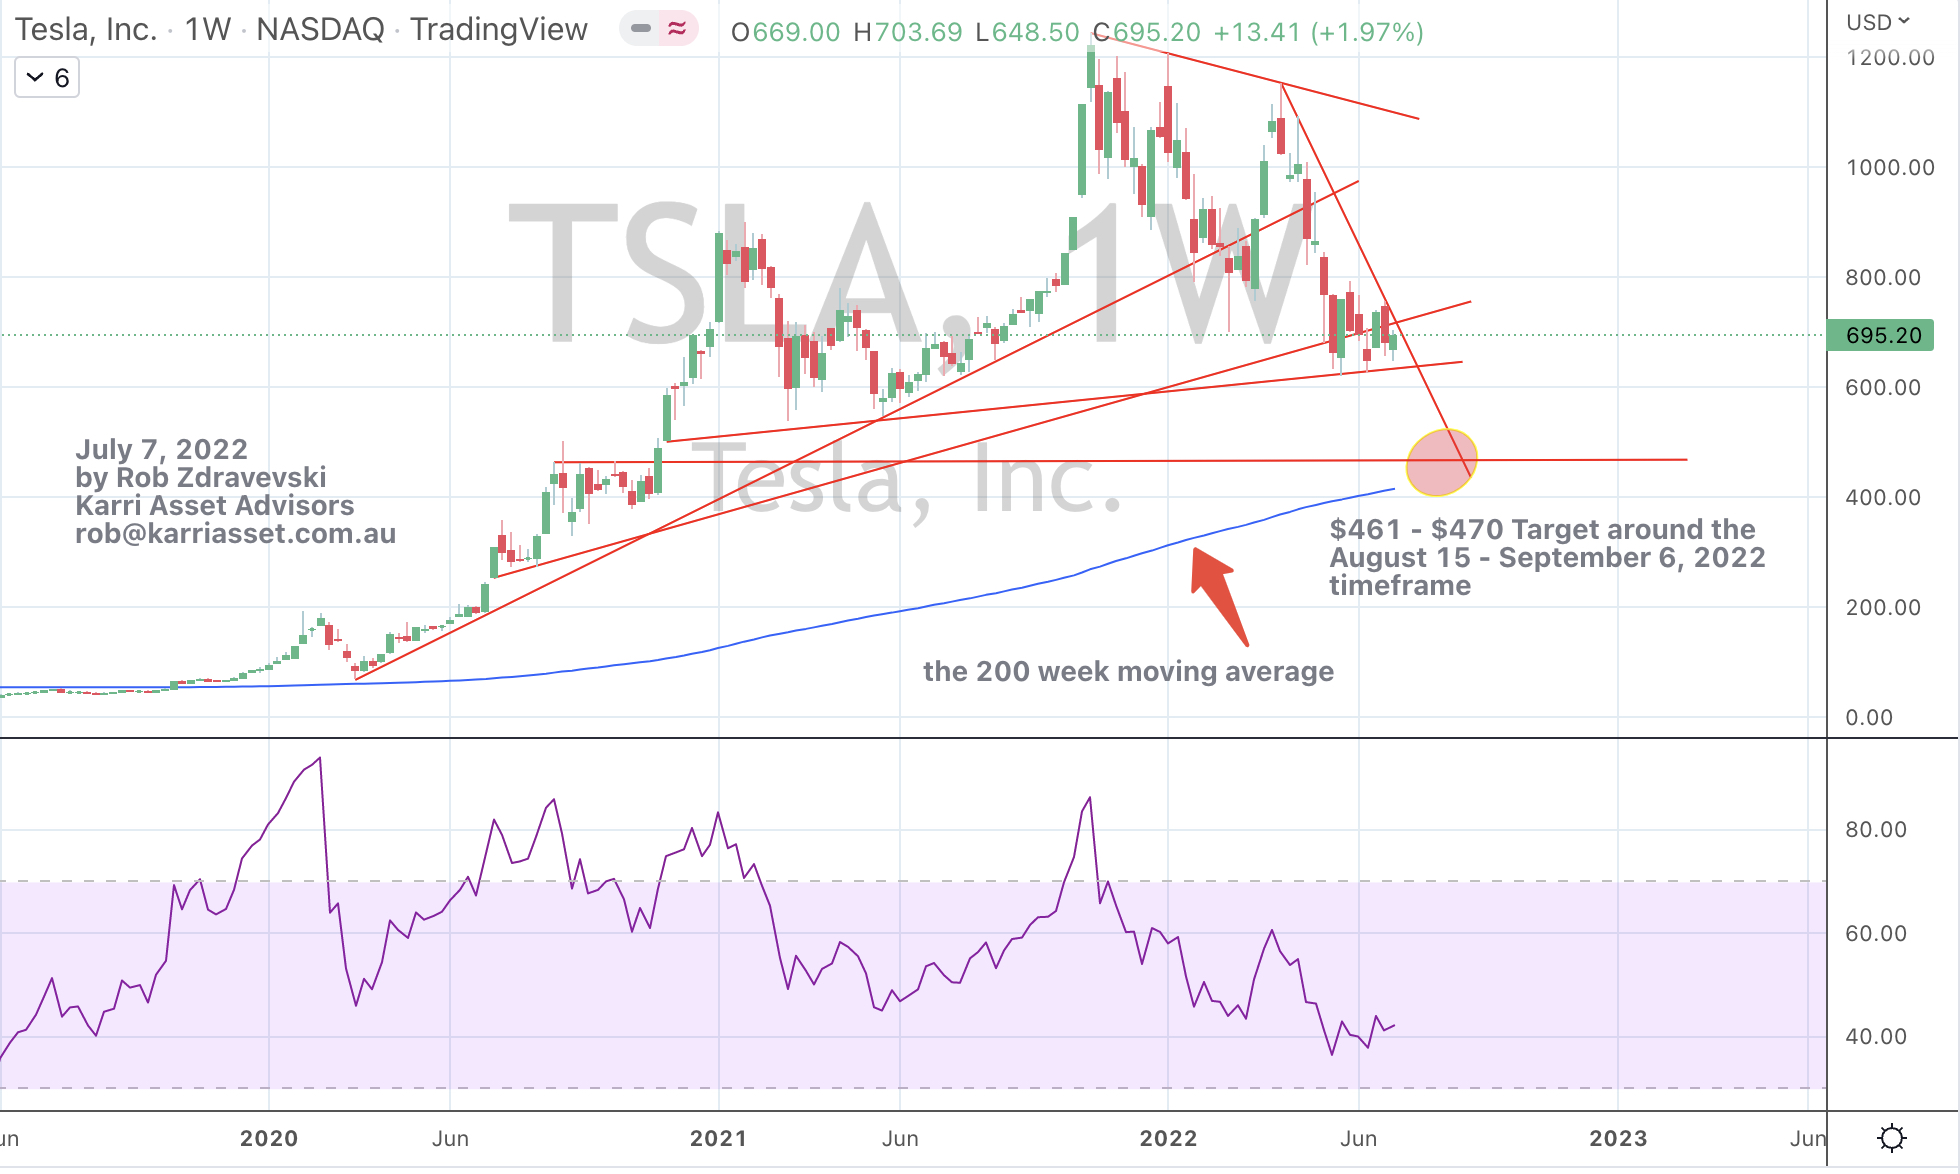
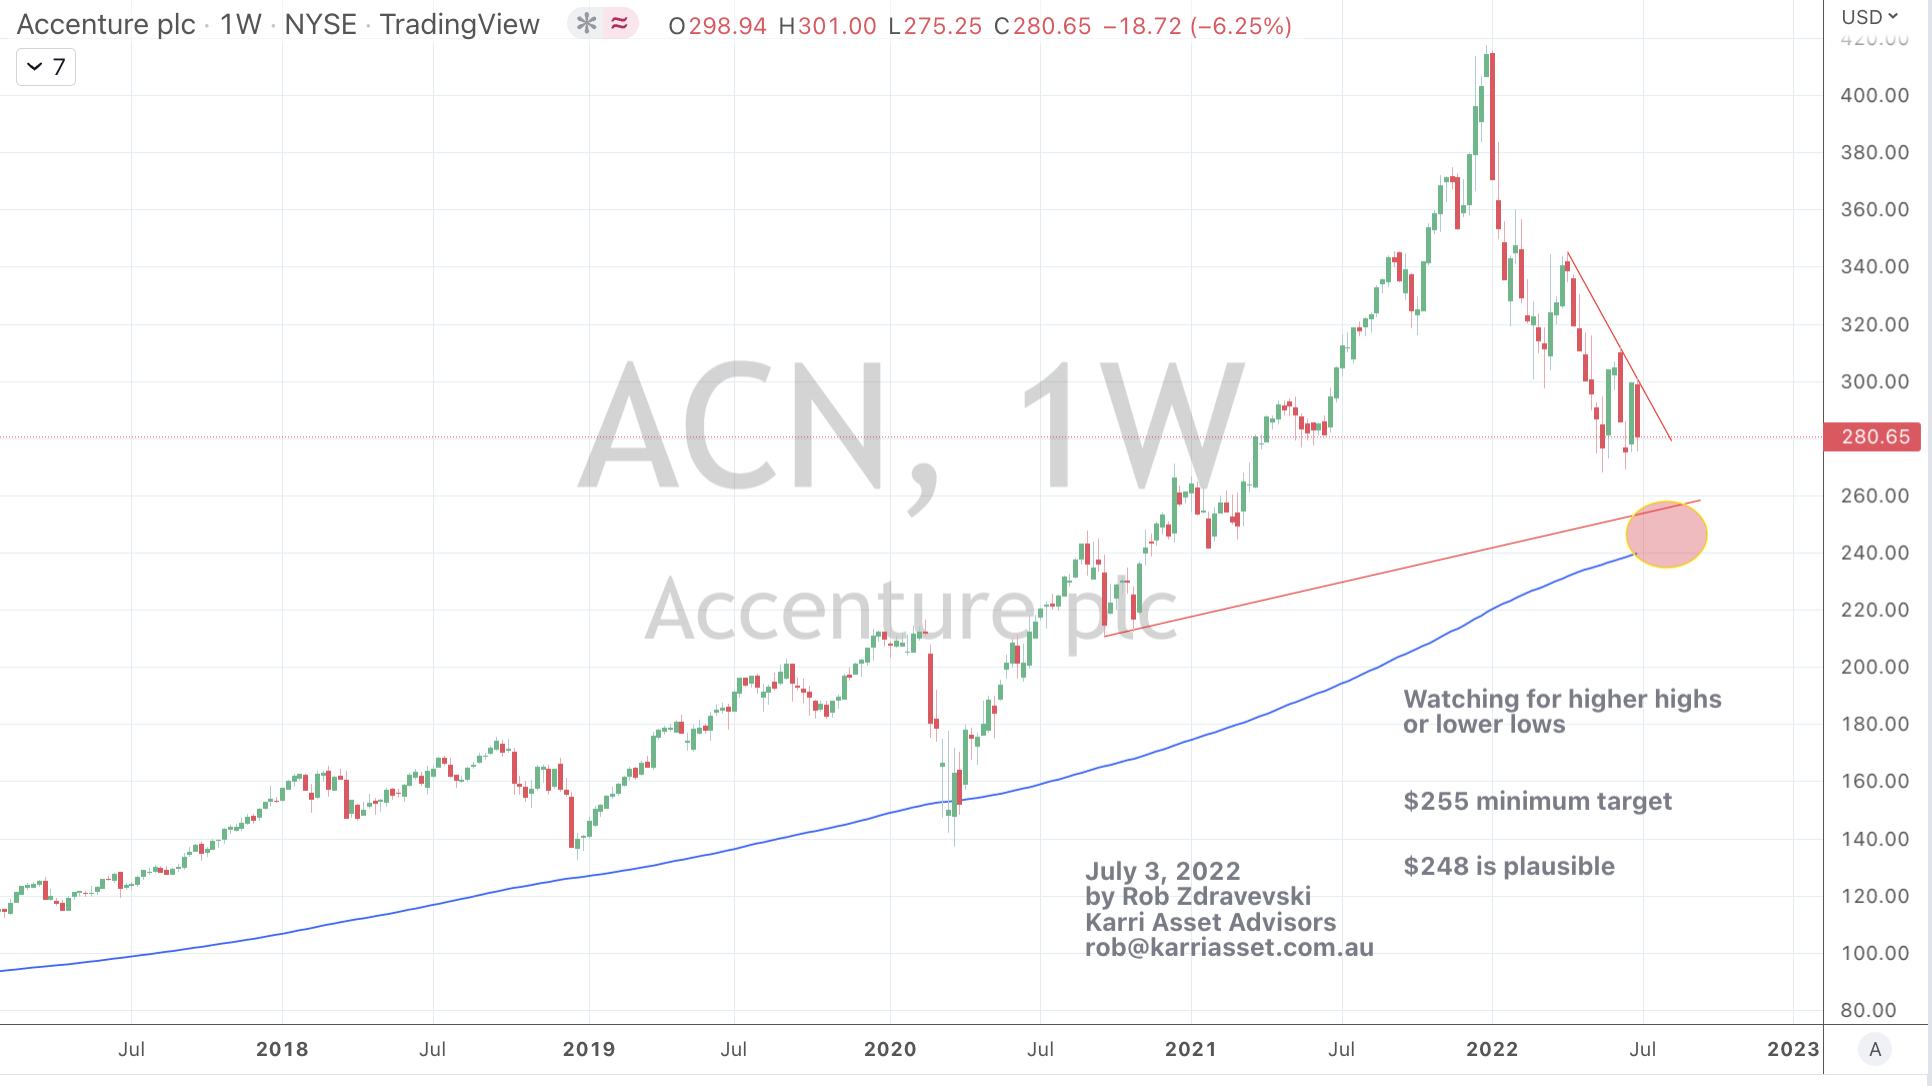
July 10, 2022
by Rob Zdravevski
rob@karriasset.com.au