The following assets (on a weekly timeframe) registered an Overbought or Oversold reading and/or have traded more than 2.5 standard deviations above or below its rolling mean.
Extremes “above” the Mean (at least 2.5 standard deviations)
U.K. 10 year government bond yields
AUD/GBP (3rd consecutive week)
AUD/EUR
Overbought (RSI > 70)
U.S. 2 year government bond yield
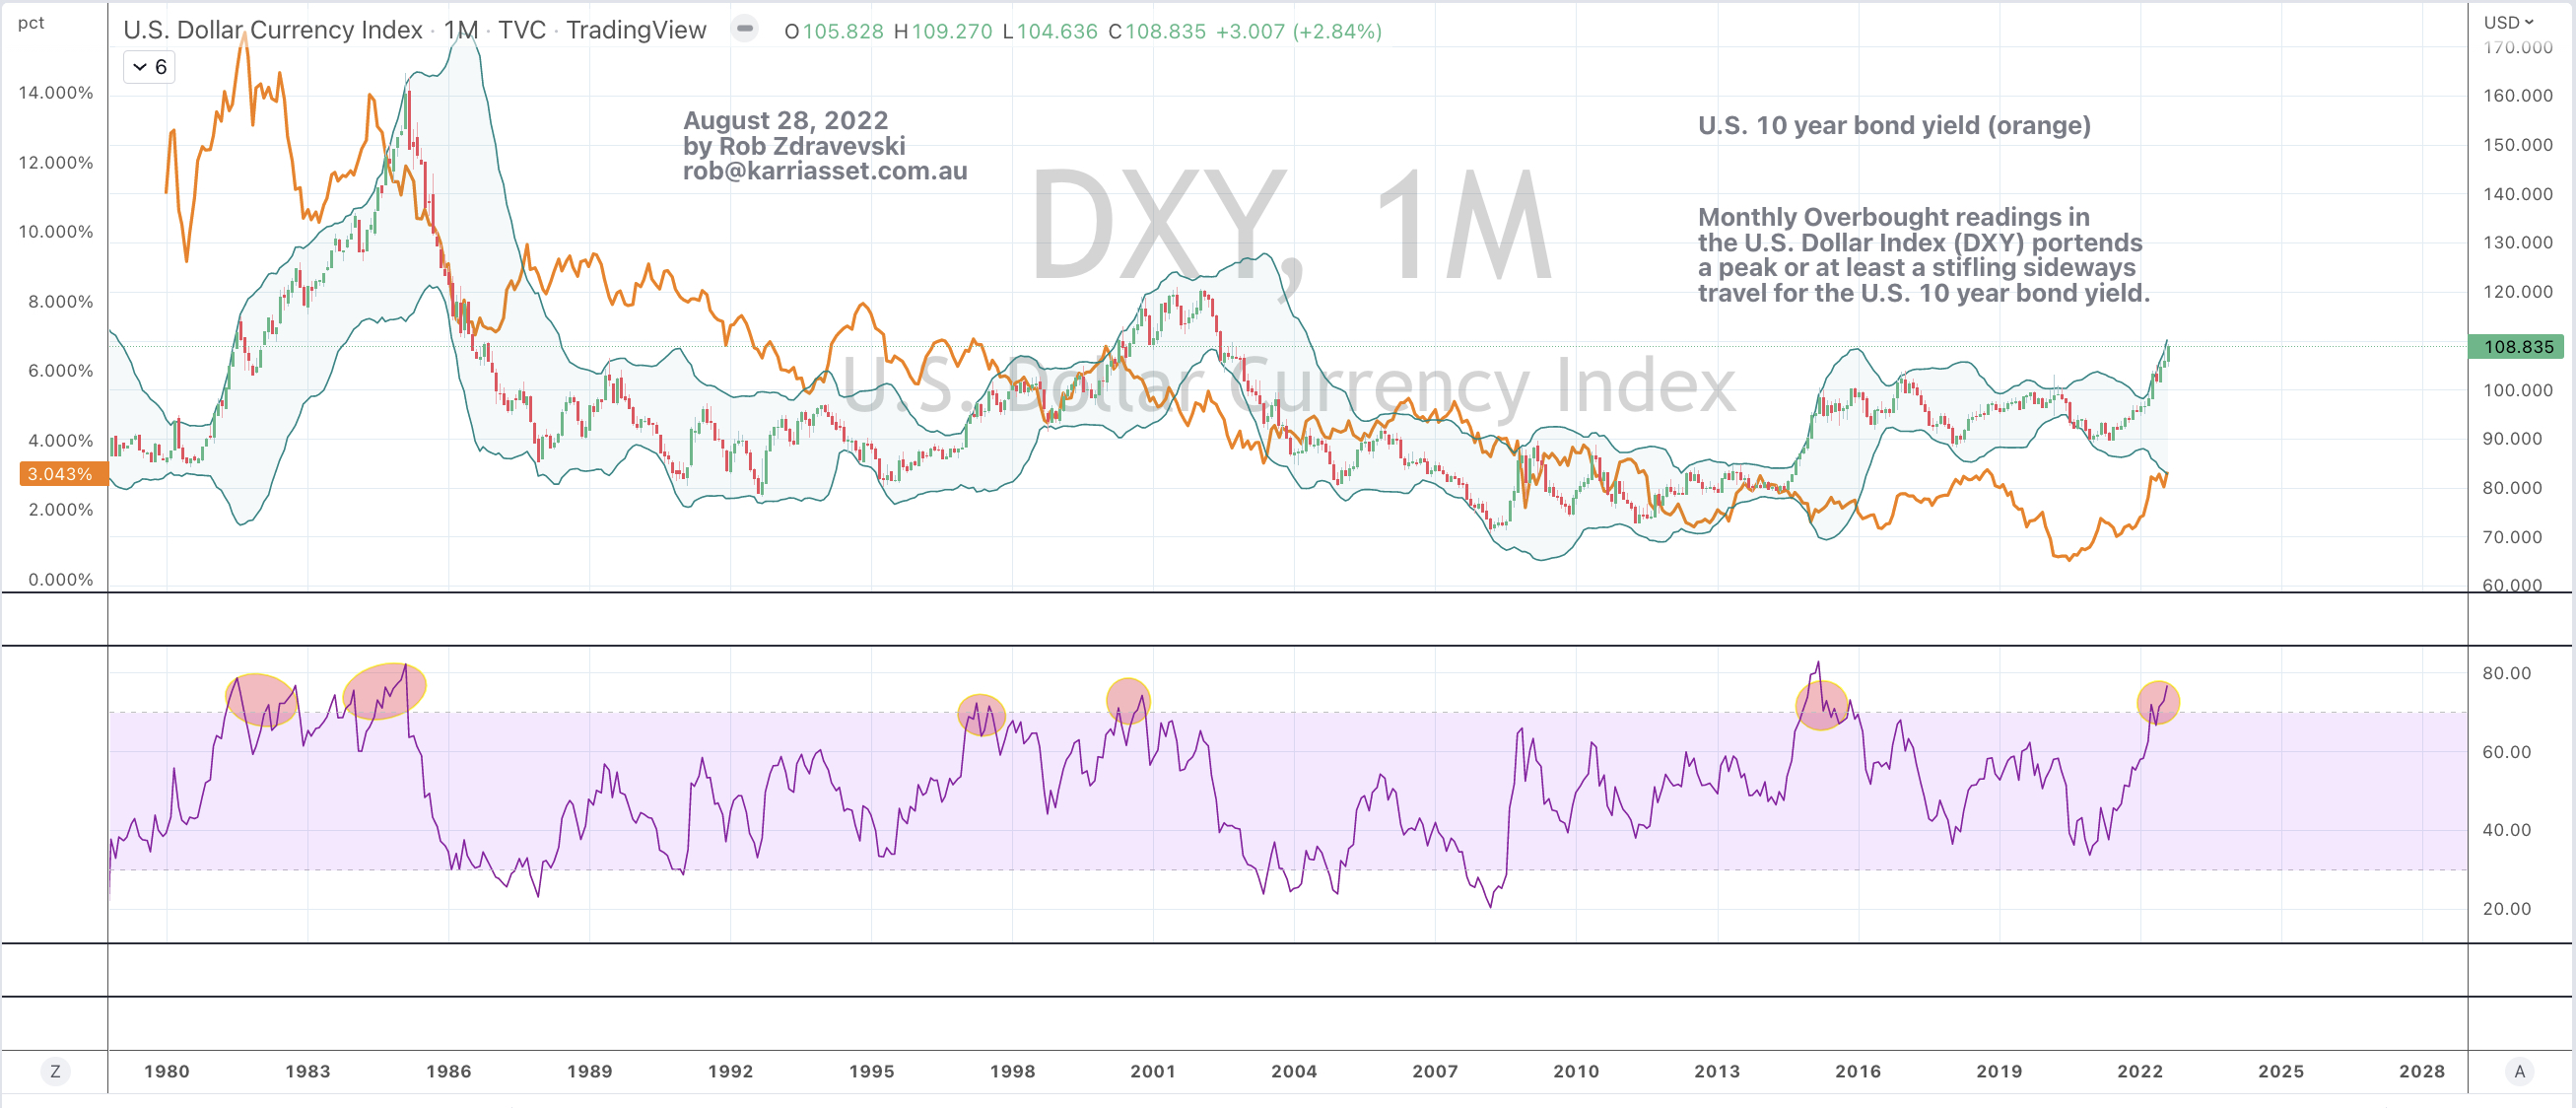
U.S. Dollar Index
The Overbought Quinella – Both Overbought and Traded at > 2.5 standard deviations above the weekly mean)
Istanbul Stock Exchange (BIST)
Dutch TTF Gas
Japan Korean LNG Marker price
Extremes “below” the Mean (at least 2.5 standard deviations)
NZD/AUD
Oversold (RSI < 30)
U.S. 5 year minus U.S.3 month government bond yield ‘spread’
Turkish 10 year government bond yields
Hot Rolled Coiled Steel
Tin
EUR/USD
GBP/USD
CNH/USD
DKK/USD
KRW/USD
INR/USD
SEK/USD
The Oversold Quinella – Both Overbought and Traded at > 2.5 standard deviations above the weekly mean)
None
Notes & Ideas:
The big news over the past week mostly occurred on its last business day where U.S. equity indices were poised to finish the week flat.
Other notable news was the renewed strength in the U.S. Dollar and subsequent oversold readings in various currencies, as this weeks list shows,
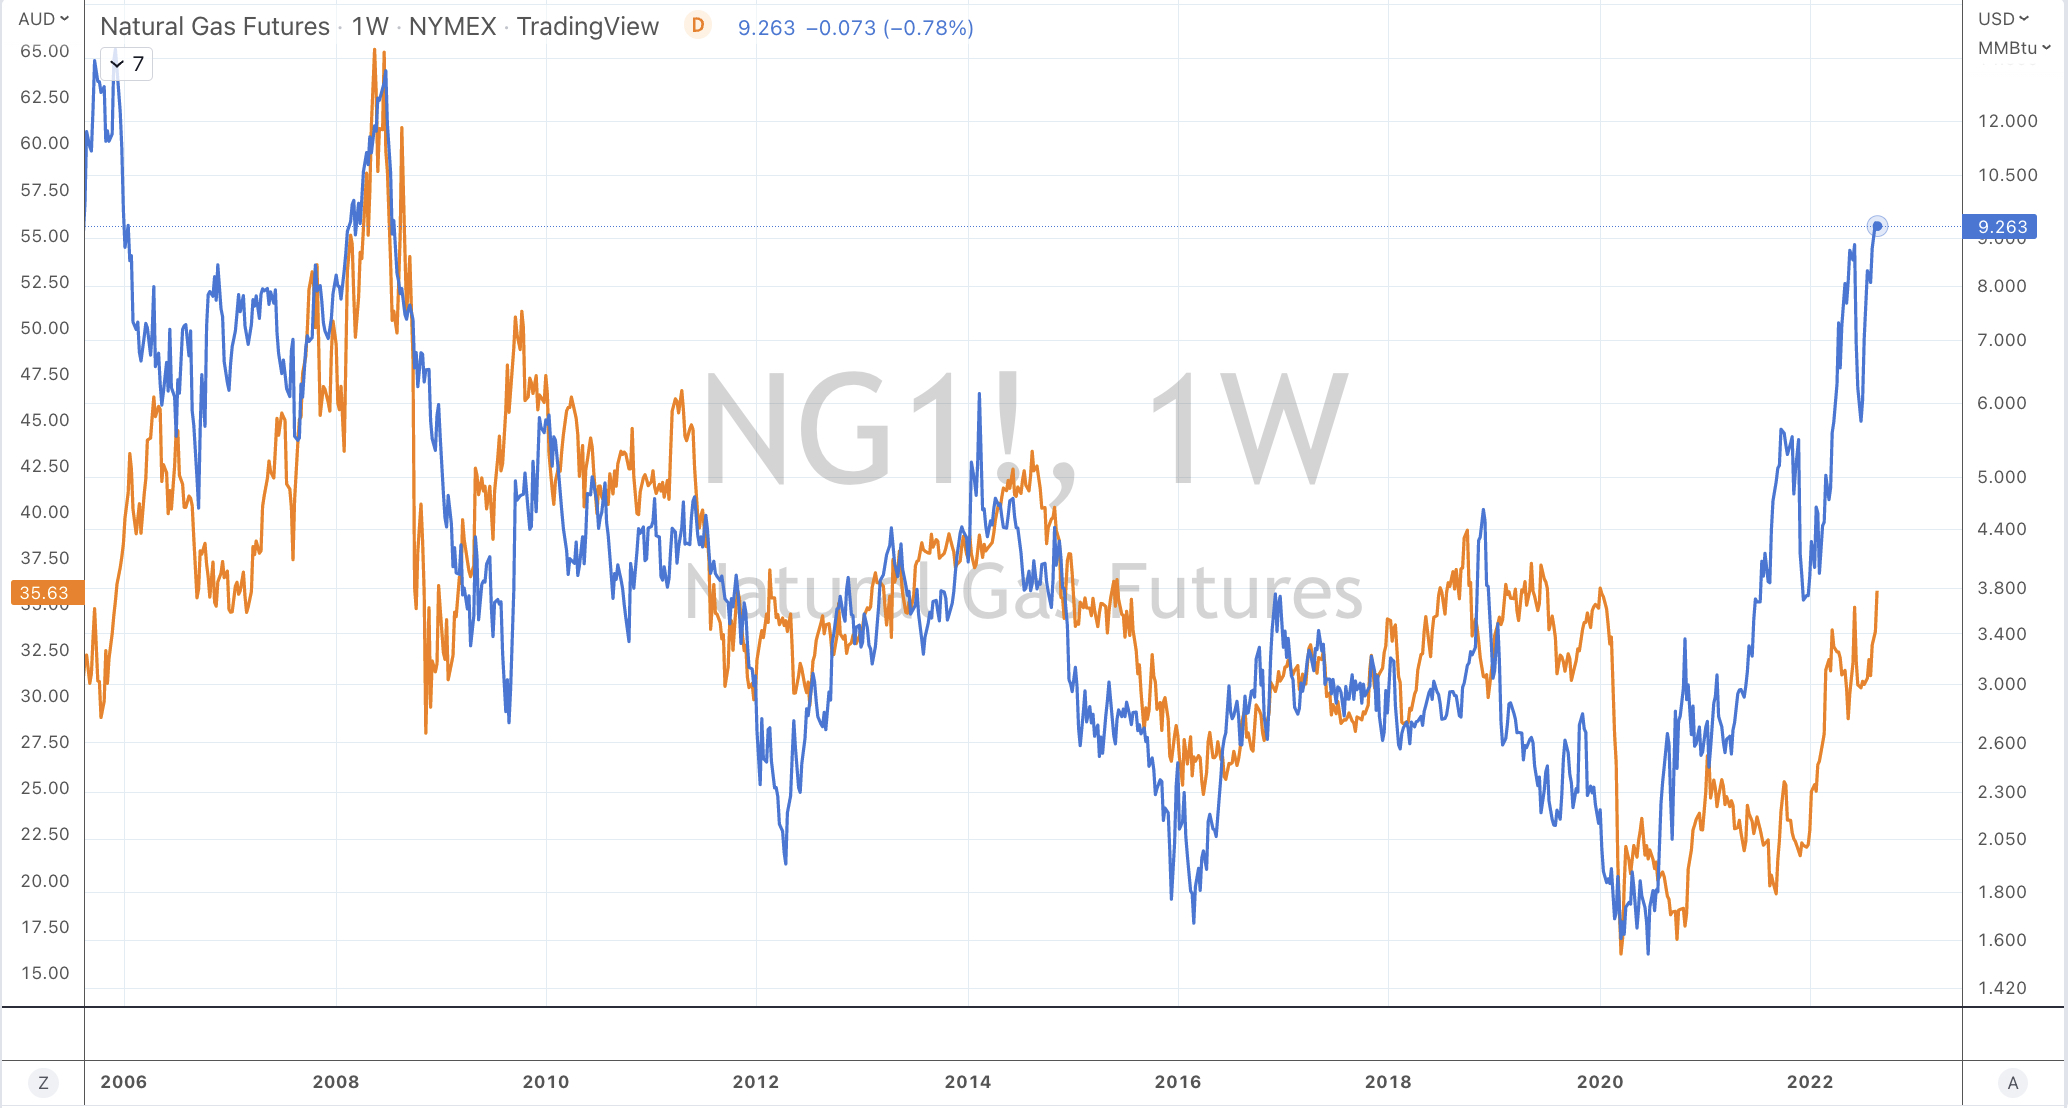
And the extraordinary surge in LNG and Dutch TTF Gas prices.
There is an undertone seen in the Japanese 10’s (at 0.22%) saying the world is reasonably OK.
Commensurately, the Copper/Gold Ratio is firming to tell us the same.
Keep in mind, that the lows in equities seen in June 2022 haven’t been breached although I’m watching keenly for any emergence of corporate earnings downgrades in Q3.
In other news, Turkish government bonds continued to bid aggressively. In fact, since the late March 2022 highs of 26%, many must of thought that Turkey’s ‘uncreditworthiness’ was overstated, for now their 10’s are yielding 13%.
In fact, Istanbul’s equity index has risen 52% since that March peak in government bond yields.
In similar, albeit shorter contrast, the U.S. 10 year bond yield peaked at 3.497% on June 14, 2022, when the S&P 500 then saw an intra-day low of 3,637. The SPX has rallied 19% over the next 2 months.
The Baltic Dry Index declined again and has done so for 6 consecutive weeks. It has fallen 6% over the past 3 months. 25% of that swoon was seen in the recent fortnight.
Over the same timeframe, U.S. RBOB Gasoline prices have declined 37% from $4.25 to its present levels of $2.68.
The larger advancers over the past week comprised of;
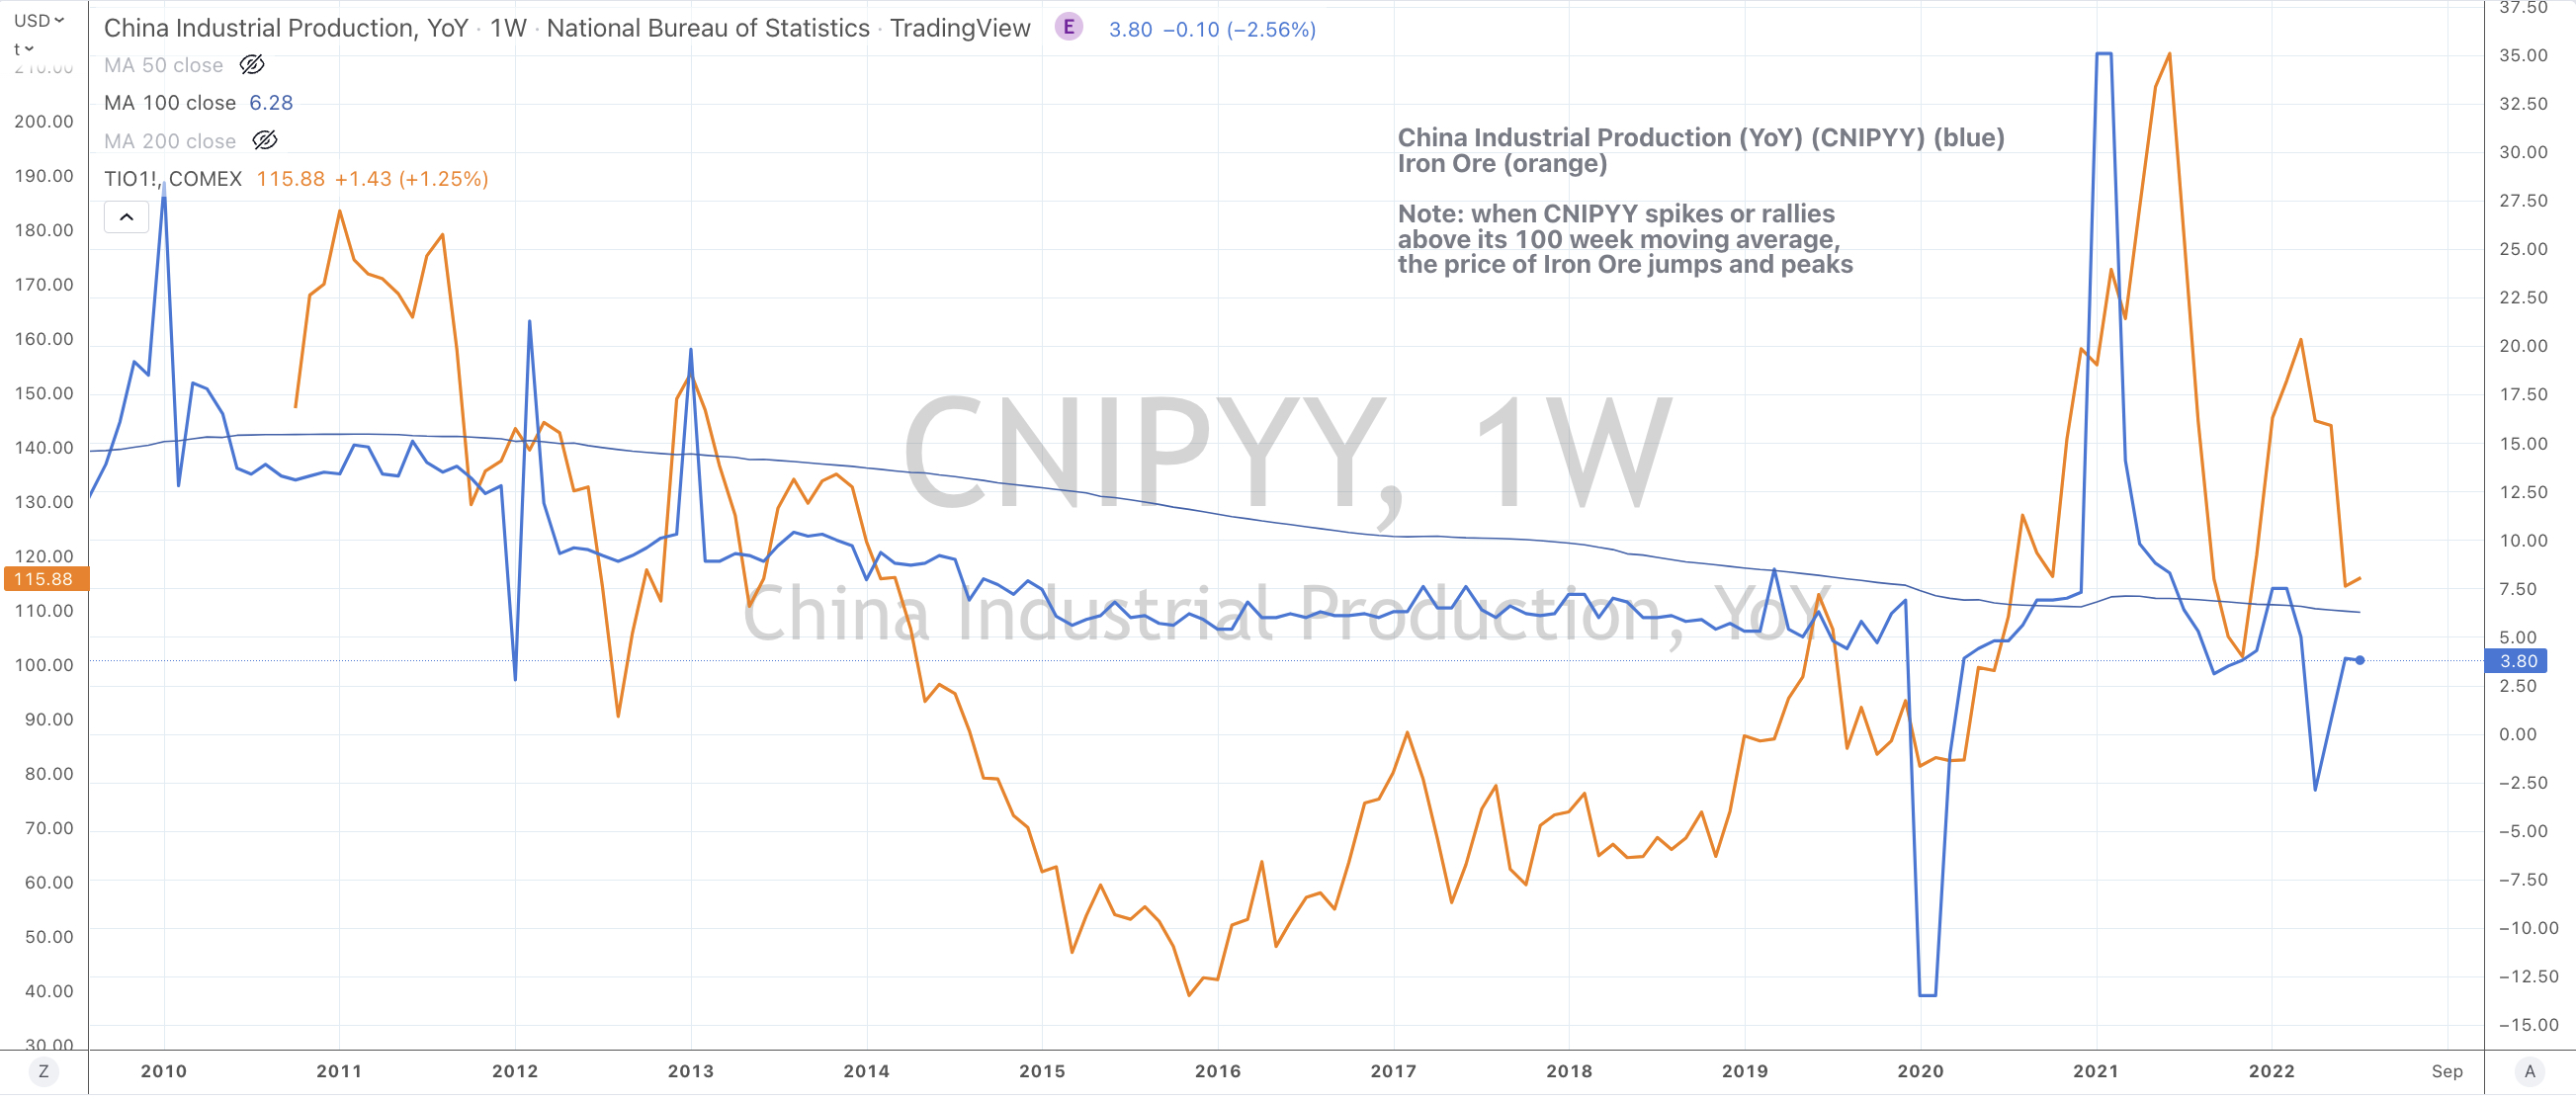
Aluminium 4.9%, Rotterdam Coal 3.2%, China Coal 15.9%, Bloomberg Commodity Index 1.9%, WTI Crude 2.9%, Iron Ore 2.9%, Gasoil 9.8%, Heating Oil 8.3%, JKM LNG 20.7%, Coffee 11.6%, Sugar 2.1%, CRB Index 2.4%, Cotton 2%, Dutch TTF Gas 41.7%, Urea 20.2% for both U.S. Gulf and Middle East prices, Brent Crude 5.2%, Corn 6.8%, Oats 3.9%, Soybean 4.1%, Wheat 4.4%, HSCEI 3%, Hang Seng 2% and Istanbul’s BIST Index rose 1.6%.
The group of decliners included;
Baltic Dry Index (12.2%), Lean Hogs (2.7%), Nickel (2.6%), Orange Juice (3.6%), Platinum (3.7%), Gasoline (11.3%), AEX (2%), KBW Banking Index (4%), CAC (3.4%), DAX (4.2%), Dow Jones Industrials (4.2%), DJ Transports (2.7%), IBEX (3.3%), S&P MidCap 400 (3%), Nasdaq 100 (4.8%), Copenhagen (2.6%), Stockholm (4%), Russell 2000 (2.9%), SMI (1.9%), SOX (5.2%), S&P 500 (4%), Nasdaq Biotech Index (3.4%), Nasdaq Composite (4.4%) and the S&P SmallCap 600 fell 3.3%
August 27 2022
by Rob Zdravevski
rob@karriasset.com.au