It’s closer to buying time than selling
June 14, 2022 Leave a comment
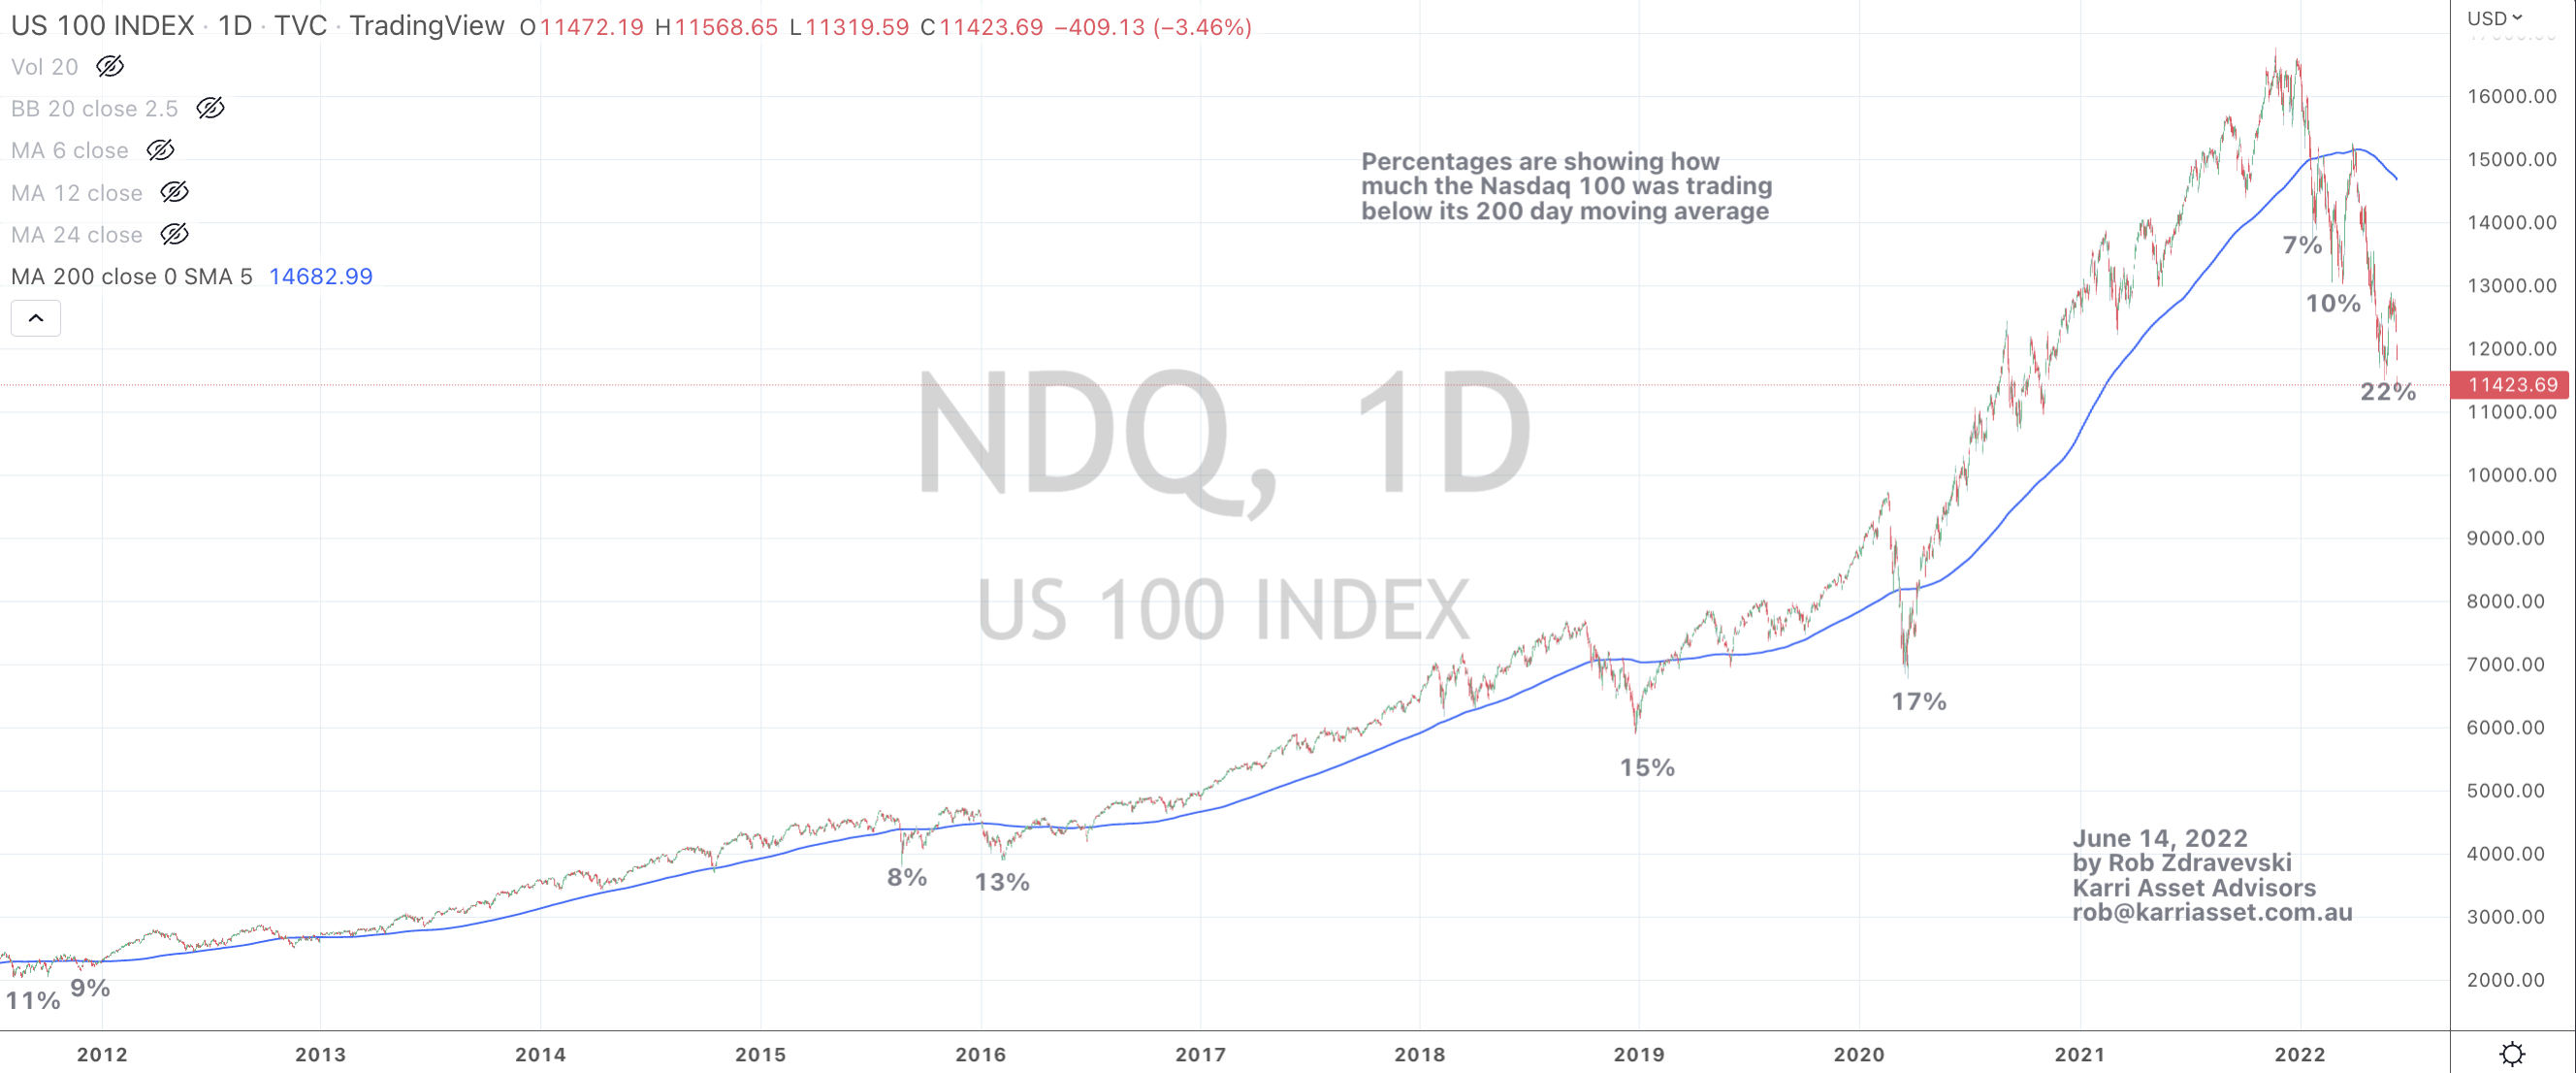
I’m reposting an updated chart with annotations showing the percentage that the Nasdaq 100 is trading below its 200 day moving average.
The Nasdaq 100 registering its largest ‘discount’ to its 200 day moving average in more than 10 years, is telling you that it is more so in buying range than selling time.
What is missing is that it isn’t yet oversold on a daily basis, let alone weekly.
In older posts I have referred to a decline in the FAANGM stocks as the ones which will help the broader index price move lower towards its 200 week moving average and an Oversold reading.
June 14, 2022
by Rob Zdravevski
rob@karriasset.com.au