Bond yields mean revert from their trough
January 10, 2022 Leave a comment
I’ve made many references about the ‘Mean Reversion Trade’, mainly from the perspective prices retracing lower following wild, parabolic moves.
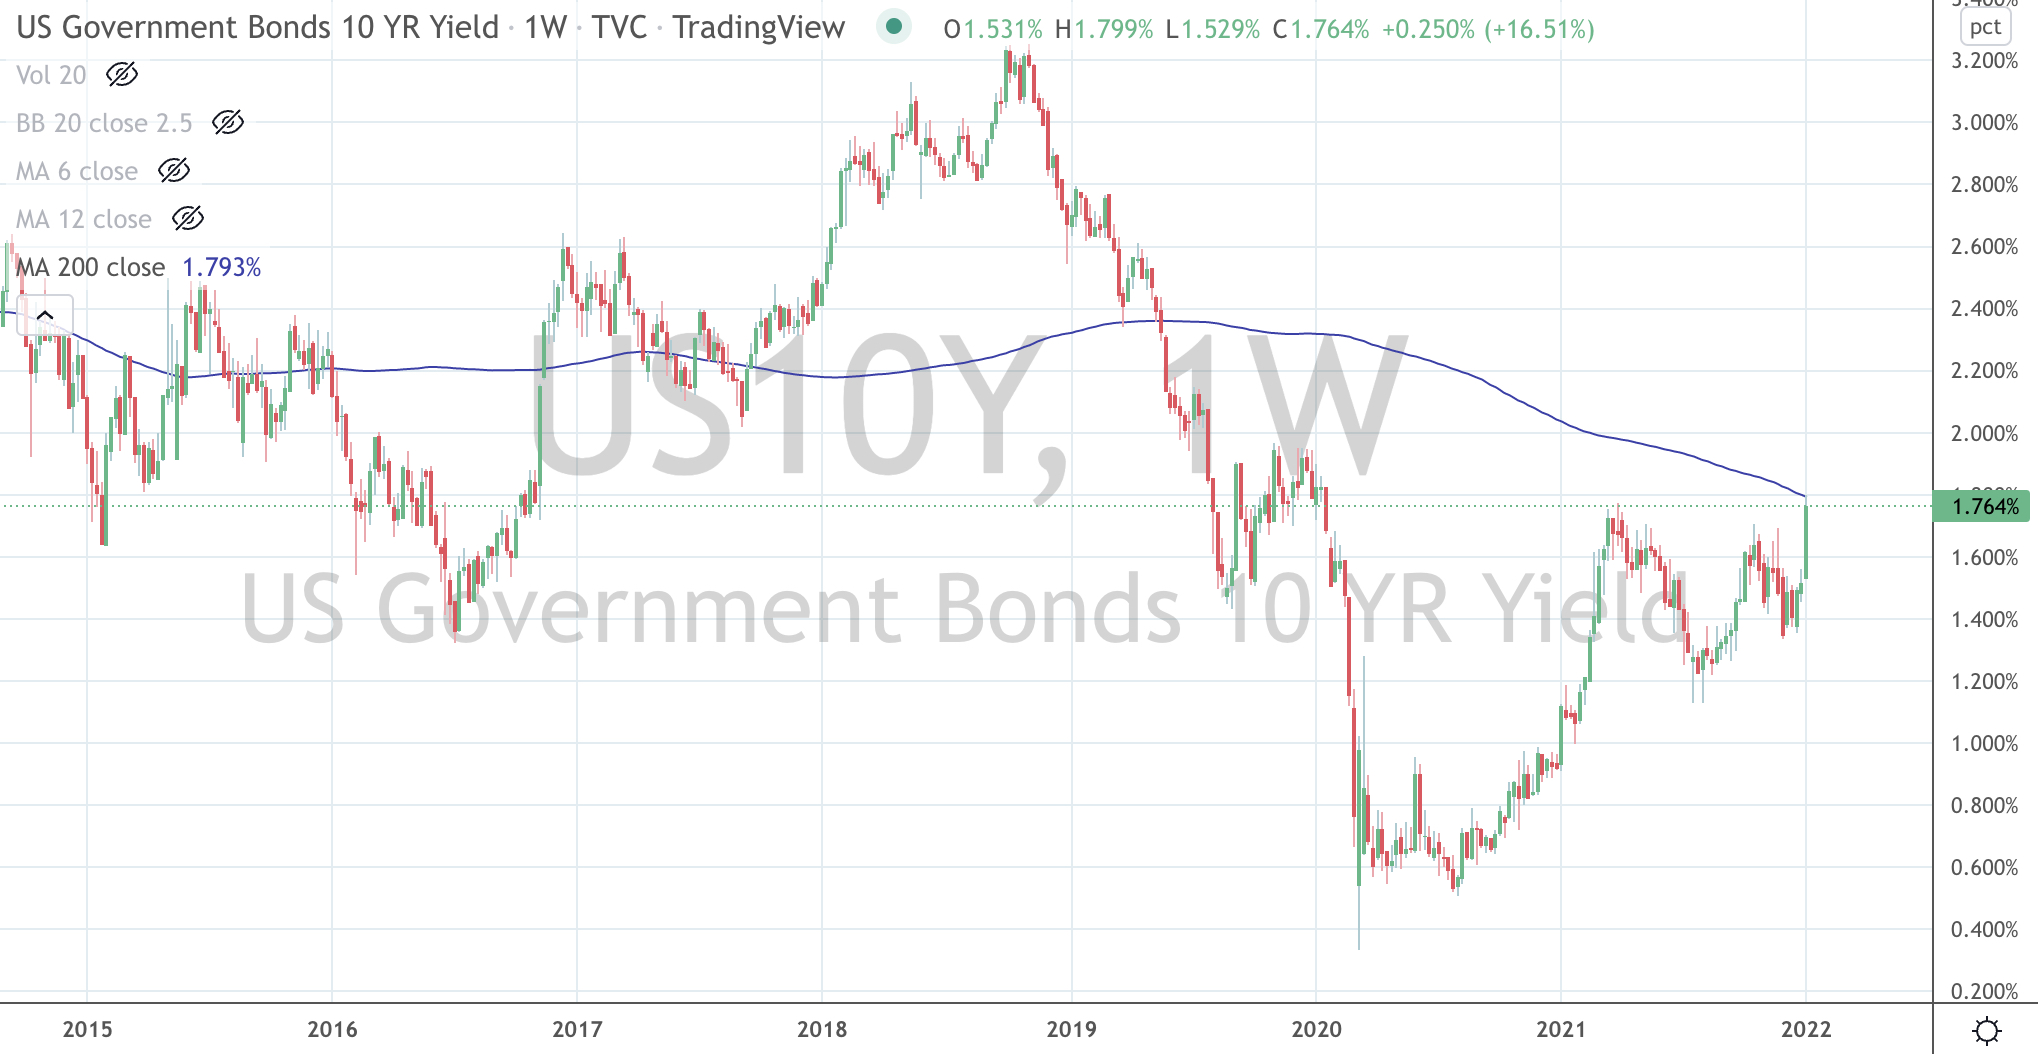
In the weekly chart below, we see a mean reversion starting from the other side.
The U.S. 10 year bond yield eventually worked its way back up to its 200 week moving average, touching that market during last week’s rally.
Incidentally, this has occurred at the same time that we saw the yield reach an ‘extreme’ 2.5 standard deviation (as mentioned in this week’s edition of “Macro Extremes”) above its rolling weekly mean.
Probability suggests a lurch higher in yields over the next week or three, which also could correlate to a ‘pop’ in the price of high growth tech stocks.
January 10, 2022
by Rob Zdravevski
rob@karriasset.com.au