Another FANNGM is doing it

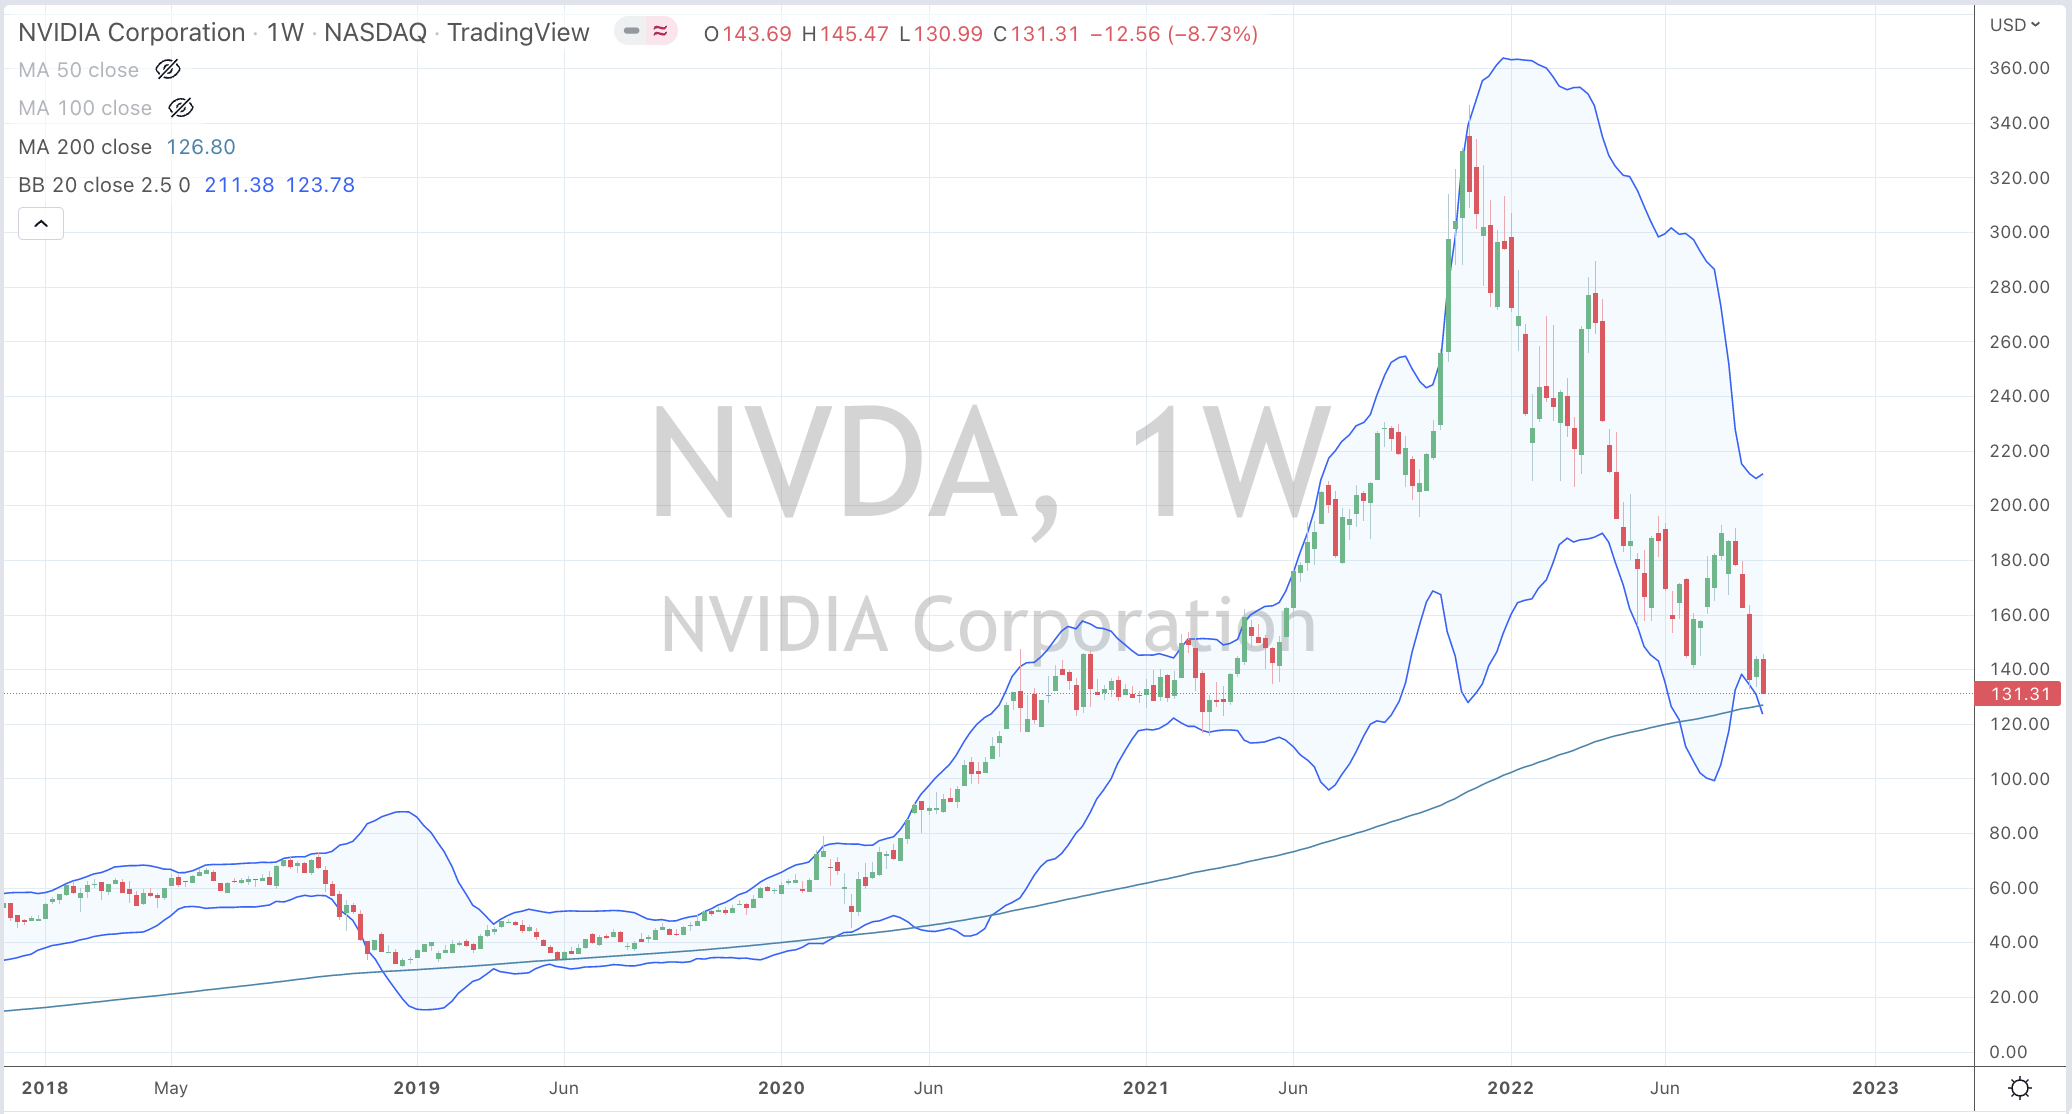
The Nvidia (NVDA:US) mean reversion is almost done.

It doesn’t necessarily mean that its 200 week moving average is the place to buy, as it may overshoot to the $103-$115 mark…..

this chart did tell you that it was dangerous chasing and buying this stock at stretched valuations as it soared way above its 200 WMA.

September 14, 2022

by Rob Zdravevski

rob@karriasset.com.au

Shorting the SOX to hedge index risk?

Continuing the series on identifying extremes, the attached “Weekly” chart show the price of Nasdaq Semiconductor Index (SOX) for the past 12 years.

My annotations highlight various times when the index is trading at ‘extreme’ percentage above its 200 day moving average.

If I don’t bang on about mean reversion, at least it shows that the probability of the index extending its move is limited.

This also makes the SOX a plausible security to short (much like the FAANGM stocks) if one is looking to hedge out index (excesses) risk.

October 28, 2020
by Rob Zdravevski
rob@karriasset.com.au