It is 1% away from a) trading at 2.5 standard deviations above its rolling weekly mean and b) registering a weekly overbought reading.
Incidentally, it has moved from 2.5 standard deviations (SD) below its weekly mean to 2.5 SD’s above, within 8 weeks.
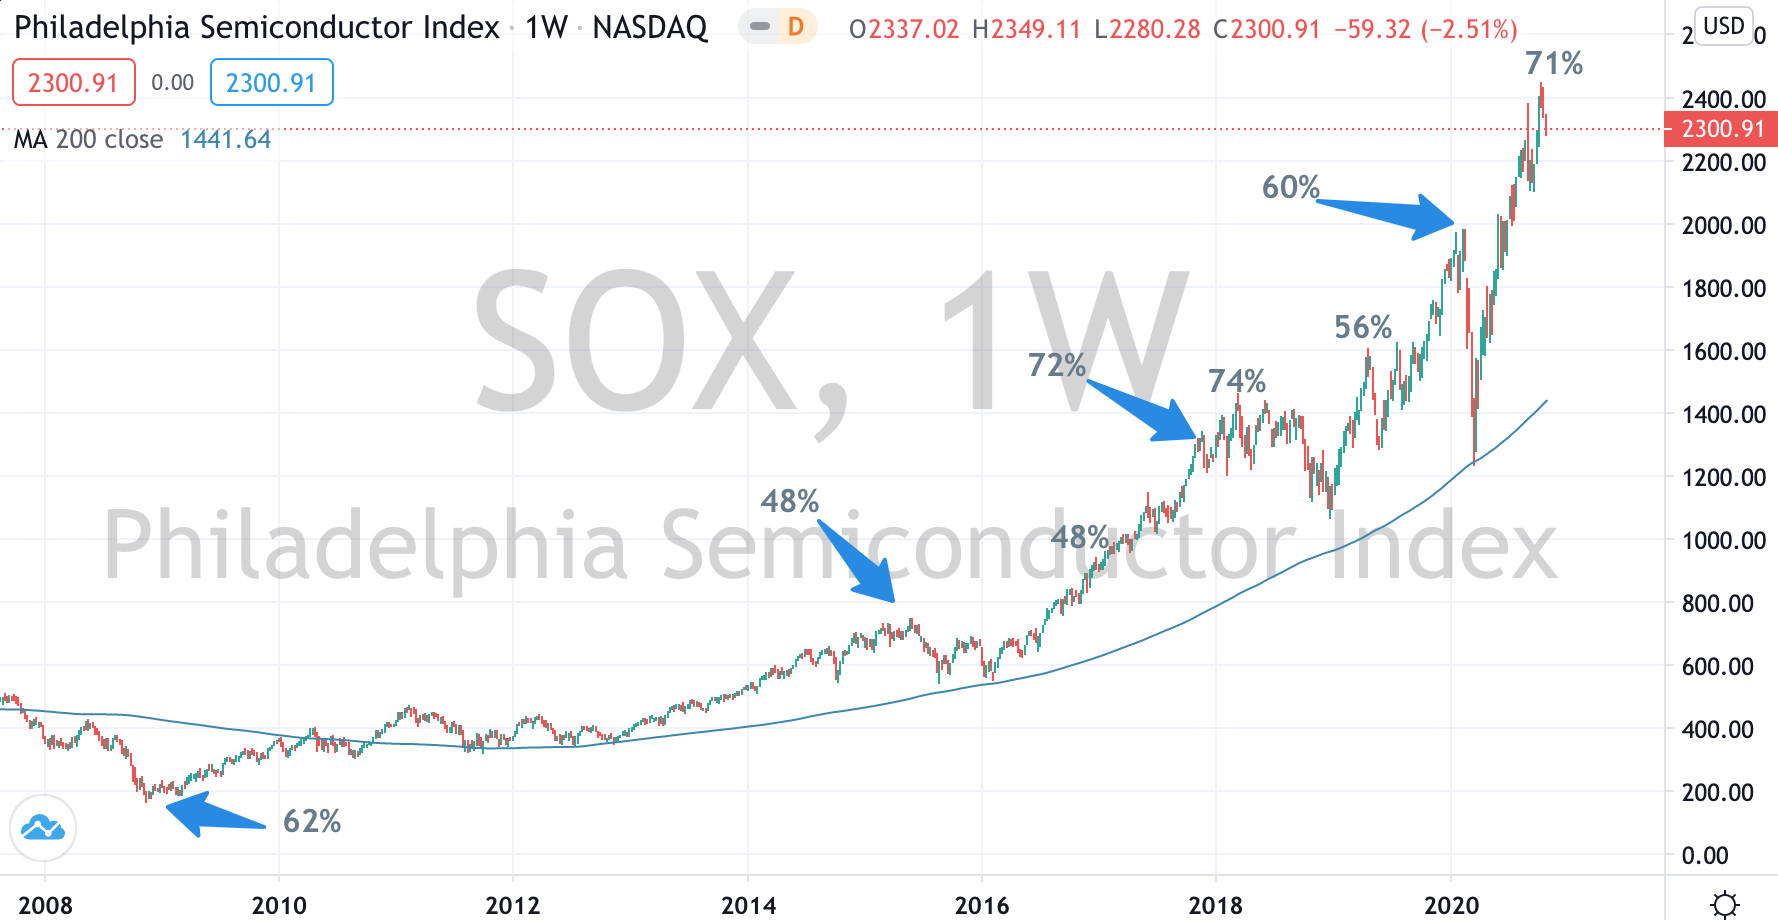
It is also trading at 27% above its 200 week moving average.
(readers of my posts will recognise that pattern).
It is in the midst of a 7 week winning streak.
Also, the Nasdaq 100 is yet to make a new ‘higher high’. That high of 16,765 was seen in November 2021.
Lastly, there are ‘gaps’ below. I’m watching the one at 14,421.
A 12% decline from today’s price would only represent a 38% retracement of this particular advance which commenced in December 2022.
What would be wrong with a 12% for an index which has risen 56% over the past 12 months?
Subjectively, the ‘Magnificent 7’ make up more than 50% of the Nasdaq 100’s market cap and they account for 30% of the S&P 500 market capitalisation.
Many others are welcome to initiate a ‘long position’ at today’s prices on the basis that a ‘break-out’ will provide them with what they are looking for.
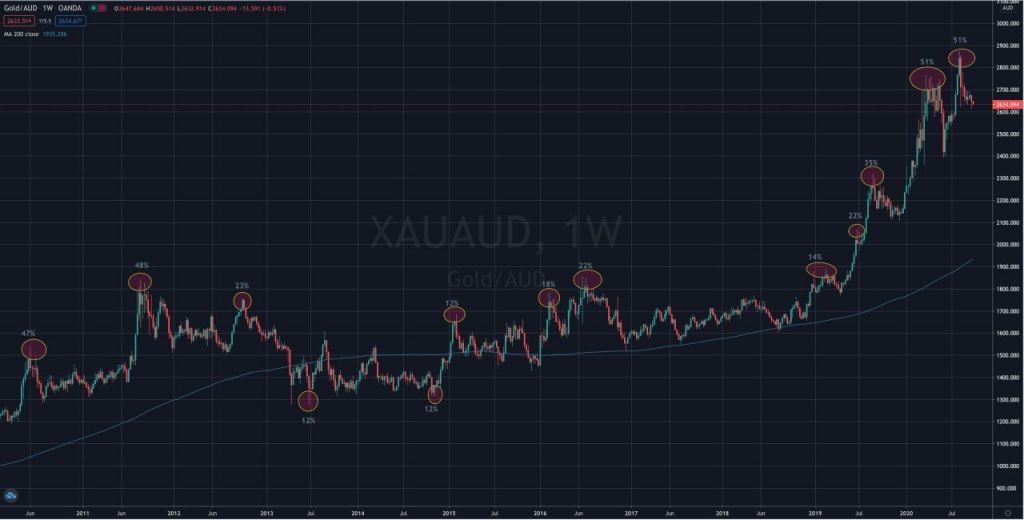
…..the chart below shows the various percentages that the XAUAUD price is relative to its 200 dma.
If you combine the recent surge in the gold price with the historic peaks of the CME gold futures margin requirements, a long term overbought reading in the AUDUSD and my other extremes seen in Gold……
you’re unlikely to lose your job, hedging your gold resource and reserves at these prices.
Incidentally, when the CME hiked margins requirements on August 11th, 2020, the AUD gold price fell and closed at A$2,676.
Today, it’s trading at A$2,636. Much of a muchness, although mean reversion and probability can be unpleasant.