Oil and Copper (not Gold) track inflation better

Gold Bugs still think that owning Gold will provide them an inflation hedge.

The chart below combines the Gold price (in USD) with the U.S. Inflation Rate together.

In addition, the lower study plots the ‘correlation coefficient’. A reading of 1 signals perfect correlation. The highlighted rectangle shows a few moments when the reading is above 0.5 but never does it reach 1.

Gold isn’t really that wonderfully correlated.

The Copper and Oil price are better….

August 19, 2023

by Rob Zdravevski

rob@karriasset.com.au

Possible traps in many stocks, this edition…Northern Star and Santos

I’m back to watching who’s making lower lows and perhaps those who aren’t making higher highs.

Northern Star Resources (NST:AX) needs to hold the $10.14 low seen in late February 2023…..but there are gaps still below which should be filled.

The latter thought is voided if you receive a takeover bid….

Santos (STO:ASX) hasn’t broken the $8.09 high of early November 2022.

In NST’s case, the downtrend is picking up strength while Santos’ upward trend isn’t so robust.

August 18, 2023

by Rob Zdravevski

rob@karriasset.com.au

Caveat emptor in lithium

Hmmm…..a company that was recently trading at $1.50 per share thus giving it a market cap of $3 billion (incidentally with zero revenues) just announced a “successful” placement of $100 million of shares at a price of 40 cents.

“Successful” for whom?

The stock fell 25% today because it offered the new tranche of shares at a 26.6% discount to the previous day’s closing price.

Why did it need to sell shares at such a discount?

Moreover, the company chose to raise capital at a similar stock price that was last seen 2 years ago and 76% below it’s peak seen 9 months ago……..

But hey, at least the stock has reverted to a significant mean and technically, the stock is oversold again.

  • not personal advice.

Cooking with (Liquid Natural) Gas

This post dated August 9, 2023, talked about the bullish price action I saw developing in LNG prices.

Since then, the Japanese Yen priced LNG contract has risen 37%.

Today, the U.S. traded (CME) LNG Japan Korea Marker “JKM” (Platts) futures contract jumped 34%.

Annoyingly, the Dutch TTF Gas contract has risen 42% over the past 13 trading days.

I say ‘annoying’ because I’d prefer prices to move in an orderly fashion. 

Prices are no longer trading at extremes and cautioned is required chasing such quick moves as there are gaps below which are often ‘backed and filled’.

August 16, 2023

by Rob Zdravevski

rob@karriasset.com.au

Does the Aussie hold 64 cents?

Within today’s Australian trading day, the AUD/USD and the price of BHP have traded down to levels mentioned in my recent notes.

The Aussie is at the mid 0.64’s and BHP is 1 cent from A$43.35.

Iron Ore is also showing weakness.

Rio Tinto’s ASX listed stock has also visited the $105 level which I have published in separate client communication.

As per my recent note, where I am ‘warming to commodities’, the art will still be in the timing of the entry.

I see prices poised at these levels.

While on a daily basis, the AUD/USD is in its 7th consecutive day of losses, we could see a small bounce (which isn’t my bag)….I will yield towards waiting to see if my next (lower) target levels are visited, as I watch whether the strength in the current downward trends traverse from a daily timeframe into a weekly one.

August 16, 2023

by Rob Zdravevski

rob@karriasset.com.au

Japan is on sale for Europeans

In Euro’s, Japan is on sale…..

This study over a monthly basis shows the percentage that the Euro is trading above its 50 month moving average.

The circles mark the moments when it coincides with a monthly RSI Overbought reading.

Expect Eurozone/Japan relations to strengthen….

Who would’ve thought the Euro could exhibit strength.

August, 15, 2023

by Rob Zdravevski

rob@karriasset.com.au

The Swissie’s all time high vs AUD

The Swiss Franc has never been this strong compared to the Australian Dollar.

This makes Australian assets very attractive to Swiss (domiciled) businesses and there is a few of them, such as….

Glencore, Nestle, ABB, Roche, Novartis, Zurich Insurance, Holcim, Adecco and UBS.

(we may see more travellers from Switzerland too)

However, there is also another observation and correlation to watch.

When the CHF is overbought against the AUD (signifying that global investors are chasing safety) it portends a rally in the ASX 200.

The vertical lines in the weekly chart below shows the moments when 14 such moments have occurred over the past 30 years with only 2 dubious black lines.

This event also bodes well for selected commodities.

August 15, 2023

by Rob Zdravevski

rob@karriasset.com.au

50% less rigs pumping & oil price is 50% lower

The amount of rigs in action are still below the peak seen in 2020 and 2019 and half the amount of rigs are in operation as when deployed between the years of 2011 – 2014.

At today’s $83 price of WTI, it’s 50% below the 2011-2014 price, with less production but is there less demand or have alternatives replaced that energy supply?

Here is this month’s Baker Hughes international rig count numbers.

I’ve highlighted the Canadian figures which rose month over month and LatAm is still holding rig counts at multi-year levels.

August 13, 2023

by Rob Zdravevski

rob@karriasset.com.au

Macro Extremes (week ending August 11, 2023)

A weekly Macro, Cross Asset review of prices trading at extremes which may generate future investment ideas and opportunities.

The following assets (on a weekly timeframe) either registered an Overbought or Oversold reading and/or have traded more than 2.5 standard deviations above or below its rolling mean.

Extremes “above” the Mean (at least 2.5 standard deviations)

TBT

U.S. Government 30 year bond yields

Cotton

Gasoil

Heating Oil

Overbought (RSI > 70)

Russian 10 year government bond yields

U.S. 3 month bill yields

Russia’s MOEX

Turkiye’s BIST 100

And Chile’s IPSA equity index

The Overbought Quinella – Both Overbought and Traded at > 2.5 standard deviations above the weekly mean)

None

Extremes “below” the Mean (at least 2.5 standard deviations)
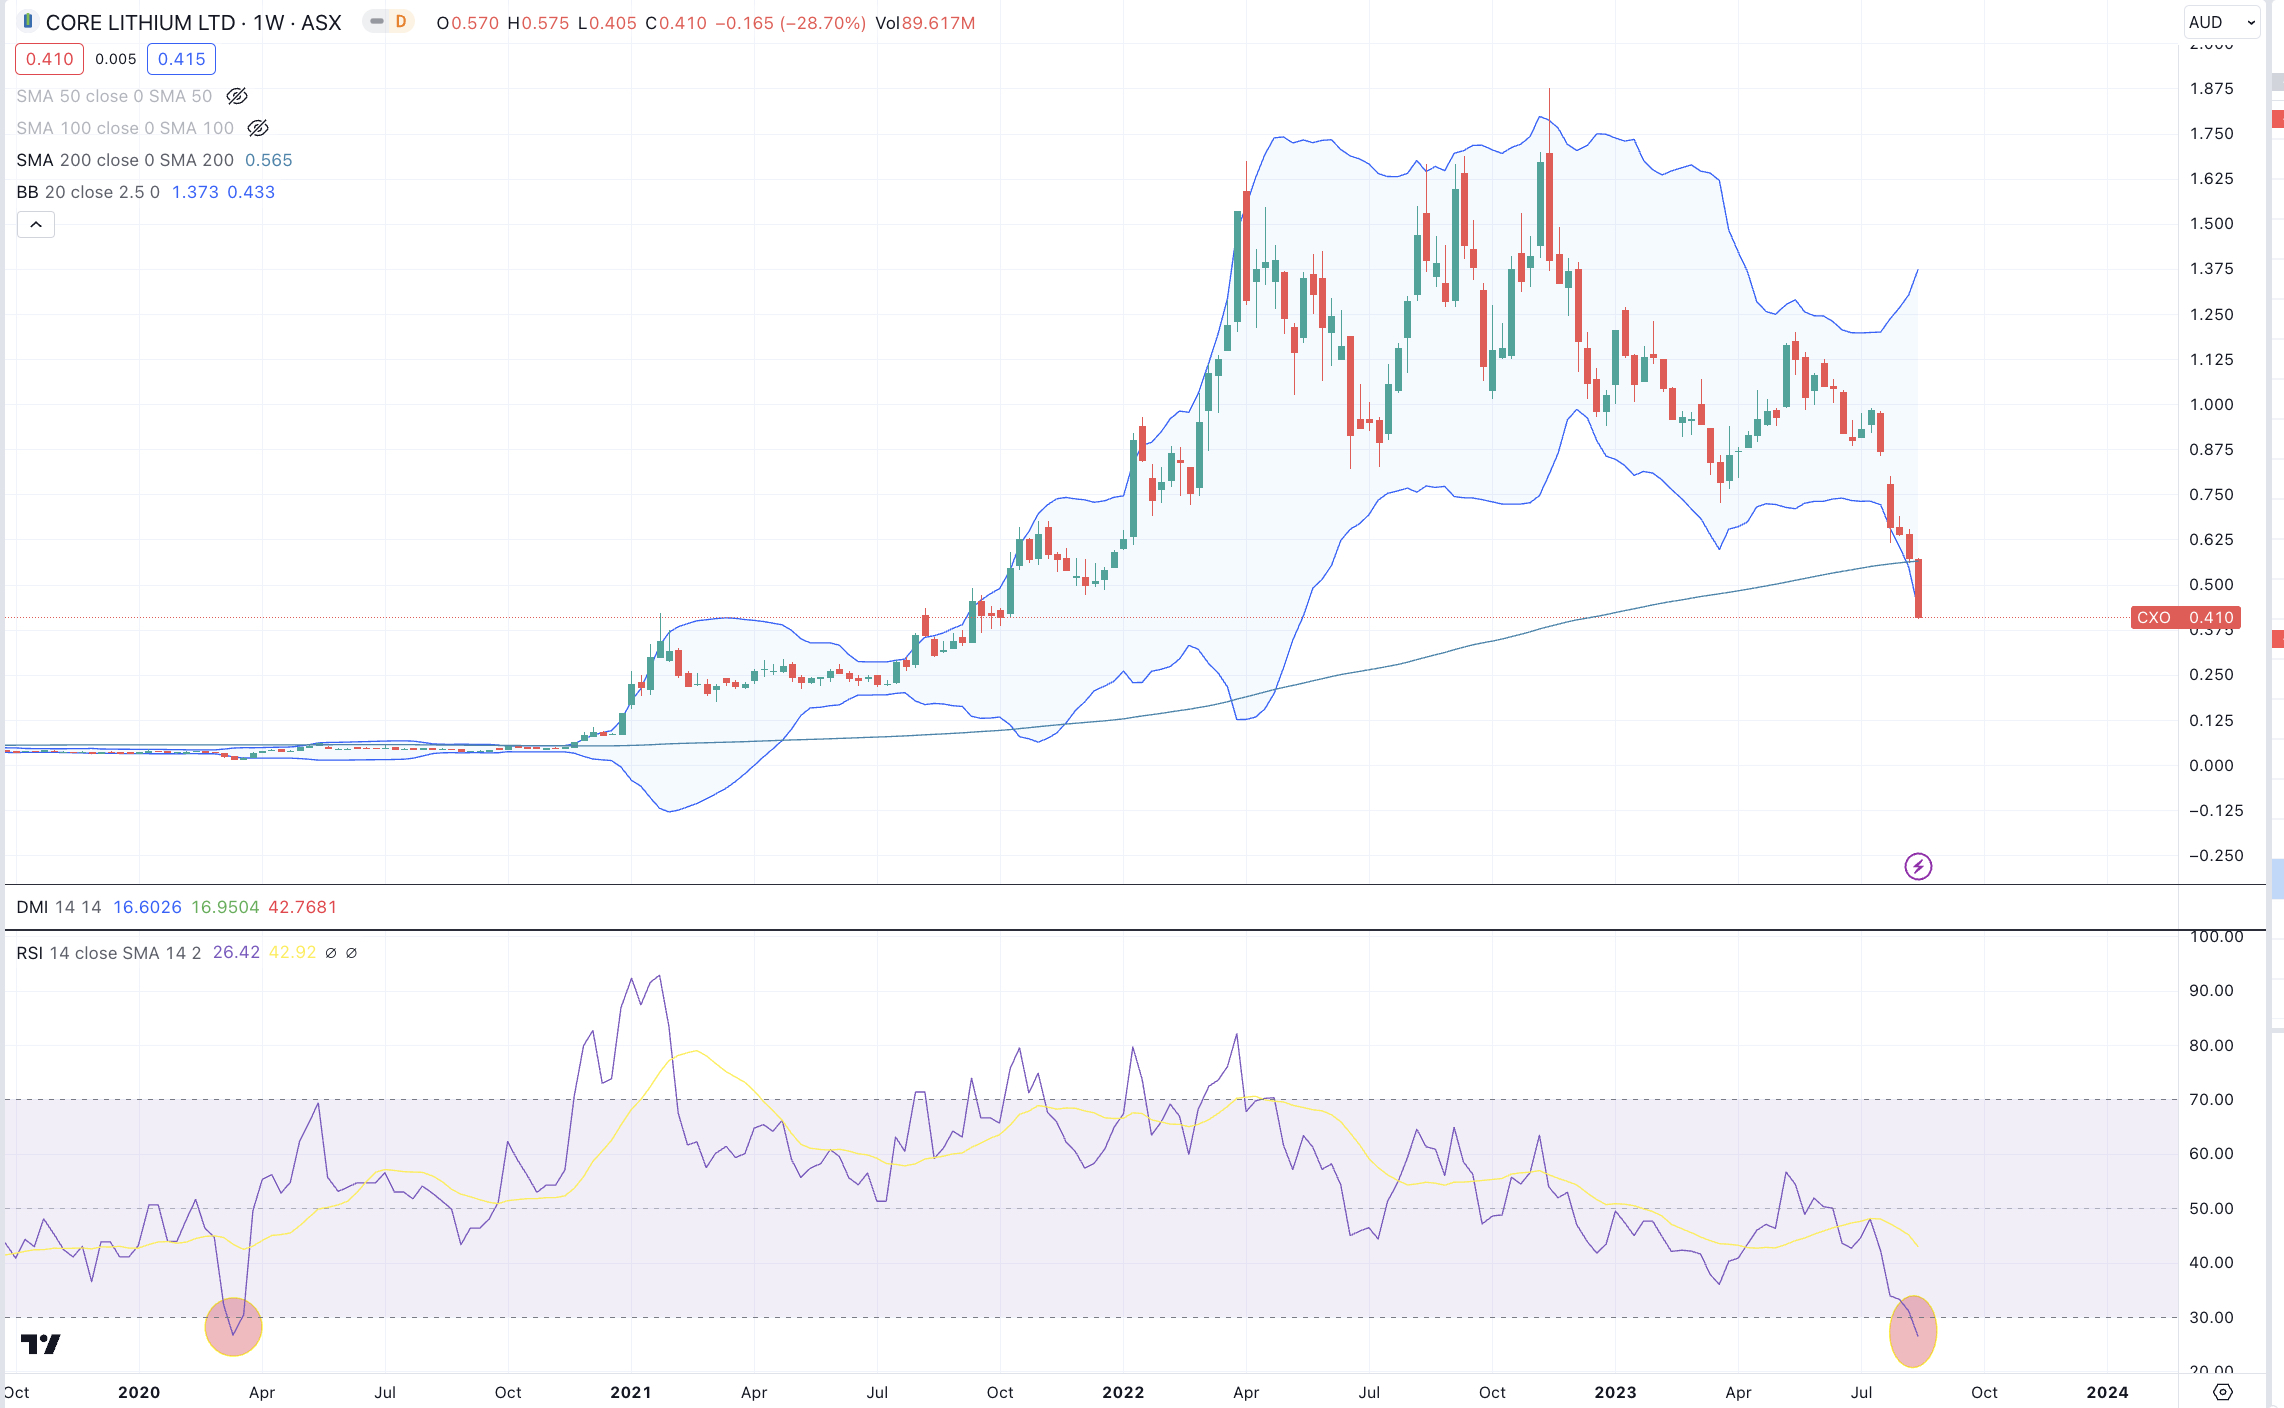
Lithium

Newcastle Coal

AUD/GBP

JPY/GBP

AUD/CHF

Oversold (RSI < 30)

CLP/USD

The Oversold Quinella – Both Oversold and Traded at < 2.5 standard deviations below the weekly mean)

None 

Notes & Ideas:

Equities mostly fell, albeit slightly compounding to last week’s weakness.

I say slightly, for only a few fell more than the 2% requisite to qualify for an appearance in the ‘largest’ decliners list.

The only indices to rise were the Nordics, Toronto’s TSX and the ASX 200.

All while Istanbul’s BIST 100 carries into its 8th consecutive week of gains, piling on gains of 9% in the past fortnight.

Commodities were mixed.

Gases and Coal were the winners while Agricultural’s and some metals were amongst the losers.

Equally, the S&P GSCI had the same sort of week (following a 5th winning a week) while Palladium saw a bullish version.

Cocoa performed an outside bearish reversal week as its breaks a 9 week winning streak 

Lean Hogs mean reverted.

In currencies, the AUD was weak everywhere and is in its 4th week of losses versus the USD.

The AUD/EUR and the AUD/GBP pairs saw their lowest closing prices since May 2020 and April 2020 respectively.

Many currency pairs streaks are into their 4th weeks on either side such as the DXY Index and the EUR/AUD is its 8th consecutive winning week.

Nd the EUR/JPY closed at its highest level since August 2008.

Bond yields rose meaning bonds were being sold off contradictory to the risk-off stance seen in equities.

Although, none of the yields made new highs.

The Australian 5 year bond yield had an outside bullish week as did the Swiss 10’s, the German 10’s and U.K. 5;s.

And the Aussie 10 year spread minus 5 year spread spent its 6th week in oversold territory.

The larger advancers over the past week comprised of;

Australian Coking Coal 2.2%, Rotterdam Coal 7.6%, China Coking Coal 2.1%, Cotton 4.3%, LNG 10%, Natural Gas 7.5%, Palladium 3.5%, Gasoline 6.5%, Sugar 2.7%, Dutch TTF Gas 22.3%, MOEX 2.1% and Istanbul’s BIST rose 4.2%

The group of decliners included;

Cocoa (4.4%), Lean Hogs (2.1%), Copper (3.3%), Coffee (2.3%), Lithium (2.7%), Newcastle Coal (2.2%), Nickel (3.1%), Silver (4.1%), Urea Gulf (4.3%), Silver in AUD (2.9%), Corn (2%),Soybeans (1.9%), Shanghai (3%), CSI 300 (3.4%), HSCEI (2.9%), Hang Seng (2.4%), Nasdaq Composite (1.9%) and the Philadelphia Semiconductor Index (SOX) fell 5%.

For some comparison, the KRE Regional Bank Index fell 1.6%, S&P 600 SmallCap Index declined 1.3%, the Nasdaq 100 retreated 1.6%, the S&P 500 eased 0.3%, the Russel 2000 and the Nasdaq 100 both waned 1.6%.

August 13, 2023

by Rob Zdravevski

rob@karriasset.com.au

Happy Birthday Luca….love from Dad

Some commodities are playing tricks

When the DXY Index registers an RSI (monthly) reading of over 65, it’s a reasonable signal to accumulate commodities.

This study is not be used in isolation nor disregard analysing the specific commodities of interest.

However, as I am preparing to accumulate certain commodities, this latest signal may be a short term bull trap, especially those chasing oil prices higher.

So my discipline will be to wait for my price and if I miss my entry price without an adequate margin of safety……then it can go on without me.

August 10, 2023

by Rob Zdravevski

rob@karriasset.com.au

Screenshot 2023-08-10 at 7.08.37 pm