Spanish yields tell me inflation will bounce

Spanish inflation was in the news this past week, reporting a rise from July’s 2.1% reading to 2.4% for the month of August 2023.

However, the main story of the Spanish inflation rate appears in the first chart below.

Mean reversion beckoned, especially following parabolic price moves.

The second chart shows the Spanish 2 year government bond yield compared to the same inflation rate.

The ‘stubbornness’ of the bond yield (in orange) holding up at 3.42% tells me that inflation move back higher.

I’ll watch for the 4.5% region as the first stop.

September 2, 2023

by Rob Zdravevski

rob@karriasset.com.au

‘No one’ is long Small Caps

While everyone is chasing ‘mega’ caps.

The study below shows the 4 notable times over the past 15 years that the S&P Small Cap 600 Index was oversold when compared to the S&P 500.

That ratio appears in blue.

The rectangles are 5 other moments when the RSI reading was 35 and ‘close enough’ to being 30.

September 1, 2023

by Rob Zdravevski

rob@karriasset.com.au

Chalice completes a reversion to the mean

There is a preface within my latest newsletter ‘Warming To Commodities’, that I have been a bearish on commodities and their related stocks for the past 2 years.

2 years ago, I wrote this note about Australian mining company, Chalice Mining (CHN:ASX) and it was an example of my bearish views.

Following that near-term August 2021 timeframe, the stock price danced between both ends of its ‘extreme pendulum’.

This week, Chalice Mining’s stock price finally mean reverted back to (and below) its 200 week moving average. This satisfies my criteria of an ‘oversold’ extreme where it’s also oversold on a weekly basis and trading 2.5 standard deviations below its weekly mean.

Whilst the downward price trend is strong suggesting further weakness (and there are gaps way below), the lesson is more about observing where the upper end of the ‘extremes’ range was and how the ‘mean’ rolls and morphs over time.

For example, back in August 2021, the 200 week moving average for Chalice sat at $1.49……now that mean is at $4.82.

Now, it’ll be important to watch if the stock price holds $3.37, which was its June 2022 trough.

Interestingly, nearly 15% of the company’s shares outstanding have been traded in the past 4 weeks of weakness.

Providing that ‘nothing is broken’, this is also an example where ‘weaker hands’ are throwing their stock away, into the hands of ‘stronger hands’.

August 31, 2023

by Rob Zdravevski

rob@karriasset.com.au

South32 closing in on mean reversion

This chart and study of Australian domiciled metals and mining company, South32 is an example of a stock price mean reverting back to its 200 week moving average.

This price action is mimicked across many commodity related stocks.

For now, I’ll wait for South32 (S32:ASX) to trade down to $2.95.

August 30, 2023

by Rob Zdravevski

rob@karriasset.com.au

Re-acquainting with the Copper/Gold Ratio

‘No one’ is ‘long’ bonds.

‘No one’ thinks bond yields will fall.

The divergence (and expected catch-up) between the Copper/Gold Ratio and U.S. 2’s and 10’s (as shown in the charts below) aids my thinking that bond yields will decline or at least converge toward their longer term means which are sitting much lower than the current ‘price’.

Once upon a time, not so long ago, I recall investors (in various meetings) telling that me “they would take 5% any day of the week”.

Today, the consensus isn’t content and wants to squeeze interest rates higher.

I’d guess that should interest rates fall notably, there is a move in consumer behaviour, asset pricing and business that many aren’t fathoming.

August 29, 2023

by Rob Zdravevski

rob@karriasset.com.au

Queuing off the AUD/USD

I’m watching the AUD/USD closely.

My previous notes have said it should hold 0.63-0.64 region and for now that remains valid……until it doesn’t.

Buying the Aussie weakness is one my larger macro trade ideas (even versus EUR and GBP)

I don’t subscribe to calls for it to trade below 0.6000 although my view could change.

The case for 0.63-0.64 support holding is because the weekly downtrend is lacking strength.

Here are some charts showing the dance between the AUD/USD and i) Australian Inflation, ii) Iron Ore prices and iii) the S&P Goldman Sachs Commodity Index.

August 29, 2023

by Rob Zdravevski

rob@karriasset.com.au

Macro Extremes (week ending August 25, 2023)

A weekly Macro, Cross Asset review of prices trading at extremes which may generate future investment ideas and opportunities.

The following assets (on a weekly timeframe) either registered an Overbought or Oversold reading and/or have traded more than 2.5 standard deviations above or below its rolling mean.

Extremes “above” the Mean (at least 2.5 standard deviations)

German, Swedish, French and Chilean 10 year government bond yields

TBT

LNG

U.S. 20 and 30 year government bond yields

Overbought (RSI > 70)

U.S. 3 month bill yields

Uranium

Oats

CHF/AUD

GBP/JPY

MOEX

And Turkiye’s BIST 100

The Overbought Quinella – Both Overbought and Traded at > 2.5 standard deviations above the weekly mean)

None

Extremes “below” the Mean (at least 2.5 standard deviations)

TLT

Shanghai Composite

Hang Seng

and Stockholm 30 equity index

Oversold (RSI < 30)

Lithium

The Oversold Quinella – Both Oversold and Traded at < 2.5 standard deviations below the weekly mean)

Chinese 10 year government bond yields

Notes & Ideas:

Equities had a mixed week with an overall higher bias.

Thailand’s SET rose 2.7% with he naming of a new Prime Minister.  

The Dow Jones Transports is in a 4 week losing streak as is the KRE Regional Bank Index. The latter having fallen 10% over that time.

While the larger news was that the Nasdaq et al. registered a winning week breaking its 3 week downturn.

The losers appearing on this weeks list are Chinese equities and American banks.

In between, many indices stayed within 1% of the unchanged mark.

For some comparison, the S&P 500 rose 0.8%, the MidCaps fell 0.1%, the Russell 2000  eased 0.3%, the Small Caps declined 0.4%, the U.S. Small Caps Value fell 1.2%, the ASX 200 declined 0.5% while the ASX Smalls Caps squeezed 0.1% higher.

Across the Commodities complex, prices were generally higher,

Sugar had a bullish outside reversal week.

Heating Oil has strung together 9 consecutive winning weeks, advancing 36% over that time.

Agricultural’s were mixed, although Oats soared 9% and into overbought territory.

The Baltic Dry Index gave all of last week’s gains.

And Silver broke its 5 week losing streak by rising 6%.

In currencies, the AUD firmed which was enough to move it out last week’s reported oversold territory.

Albeit by a slight margin, the AUD did extend its weekly losing streak against the USD, the SGD and the Indian Rupee to 6.

Many other currencies are also streaking.

The CAD/USD, the NZD/USD and the EUR/USD are in 6 week losing streaks. The latter appeared in this publication during July 10-17 editions as being overbought, which was the first time the Euro was so since July 2020.

A year earlier, the EUR/USD was trading at 0.9700 and the financial media was hyperventilating about it breaking parity. Funny how things turn when you watch the ‘tape’ rather than absorb noise. 

The USD/DKK and USD/SEK are in the 6 week winning streaks. The opposite applies to the reciprocal currency.

The CHF/AUD broke its 9 week consecutive rising run.

The U.S. Dollar (DXY) has now risen for 6 straight weeks.

And the GBP was weaker. It’s not overbought versus the AUD and it produced a bearish outside reversal week vs the USD and the JPY.

Bond yields fell and intra-week many did not trade higher than the previous weeks high.

I say that bond yield fell…well all but for the U.S. shorter dated 2’s, 5’s and 7’s.

And Chinese 10 year yields are at their lowest close since April 2020.

The larger advancers over the past week comprised of;

Aluminium 1.7%, Rotterdam Coal 5%, Cotton 4.4%, Gasohol 2.9%, Heating Oil 4.6%, Coffee 2.1%, Tin 4.6%, Platinum 3.6%, Gasoline 1.7%, Sugar 4.5%, Silver 6.6%, Silver in AUD 6.5%, Oats 8.7%, Soybean 2.6%, Nasdaq Composite 2.3%, Nasdaq 100 1.7%, SET Index 2.7% and the BIST 100 rose 2.7%.

The group of decliners included;

Baltic Dry Index (12.7%), Hogs (2.7%), Lumber (3.5%), LNG in Yen (7.1%), Orange Juice (2.9%), Palladium (2.5%), Dutch TTF Gas (4.5%), Corn (1.8%), Wheat (2.7%), JKM (3.5%), Shanghai (2.2%), CSI 300 (2%), KBW Bank Index (2.1%) and the KRE Regional Bank Index fell 2.5%.

August 27, 2023

by Rob Zdravevski

rob@karriasset.com.au

How Australian supermarket profits are presented to the masses

Been a while since written a social and investor behaviour post….

Australian supermarket retailers Coles and Woolworths reported their full year 2023 financial results.

I was aghast while watching last night’s tabloid magazine TV programs.

(I don’t know why the television was on that channel, at that time)

The ‘revolting’ headline said Coles posts $1 billion in profit.

The sub text implied “all this profit while many are struggling to make ends meet”.

Such a critical headline aimed at the financial results of a corporation does not appear on American TV. Only in Australia….

I don’t need sensitivity training nor am I sympathiser to the supermarkets. I am objectively flabbergasted by the stupidity being peddled to the masses as I’m drowning in pragmatism.

These businesses are ‘for profit’ organisations owned by shareholders.

There is a huge amount of trade that these supermarkets create. They pay large electricity bills and rent, rely on refrigeration mechanics, cleaners make the place shine, there is a hugh supply chain, truck drivers deliver those goods, they employ a combined 230,000 people whilst they inventory and perishable risk.

Many Australian visit these supermarkets for their staples yet we are the quickest to lambast them.

I have an idea…….Let’s (somehow) force the closure of these supermarket goliath’s.

What then…..are we all going to find conveniently located community co-ops providing competitive pricing with broad ranges whilst supporting the supply chains and providers (which incidentally carries on the circle of commerce) ?

Coles fiscal year revenues were A$40.5 billion and they made a net profit of A$1.04 billion. A net margin of 2.6%.

Woolworths reported fiscal year revenues of A$64.3 billion and its net profit was A$1.7 billion. A net margin of 2.6%

That’s an awful lot of product, receipts and payments to handle and process for a measly 2.6% profit margin. This is their risk to take to our convenience.

This is also why I don’t like investing in supermarket stocks. They are a terrible net margin business.

By the way, privately owned Aldi has global revenue close to an equivalent of A$190 billion.

But hey, let’s just listen to some TV reporters guiding us towards what we should be angry about.

Buying straw hats in a Chinese winter

While ‘everyone is short’ China…..in the study below, the vertical lines intersect moments when the China A50 Index is below its 100 week moving average, trading 2.5 standard deviations below its weekly mean and where the weekly RSI reading is 37 or less.

August 22, 2023

by Rob Zdravevski

rob@karriasset.com.au

Macro Extremes (week ending August 18, 2023)

A weekly Macro, Cross Asset review of prices trading at extremes which may generate future investment ideas and opportunities.

The following assets (on a weekly timeframe) either registered an Overbought or Oversold reading and/or have traded more than 2.5 standard deviations above or below its rolling mean.

Extremes “above” the Mean (at least 2.5 standard deviations)

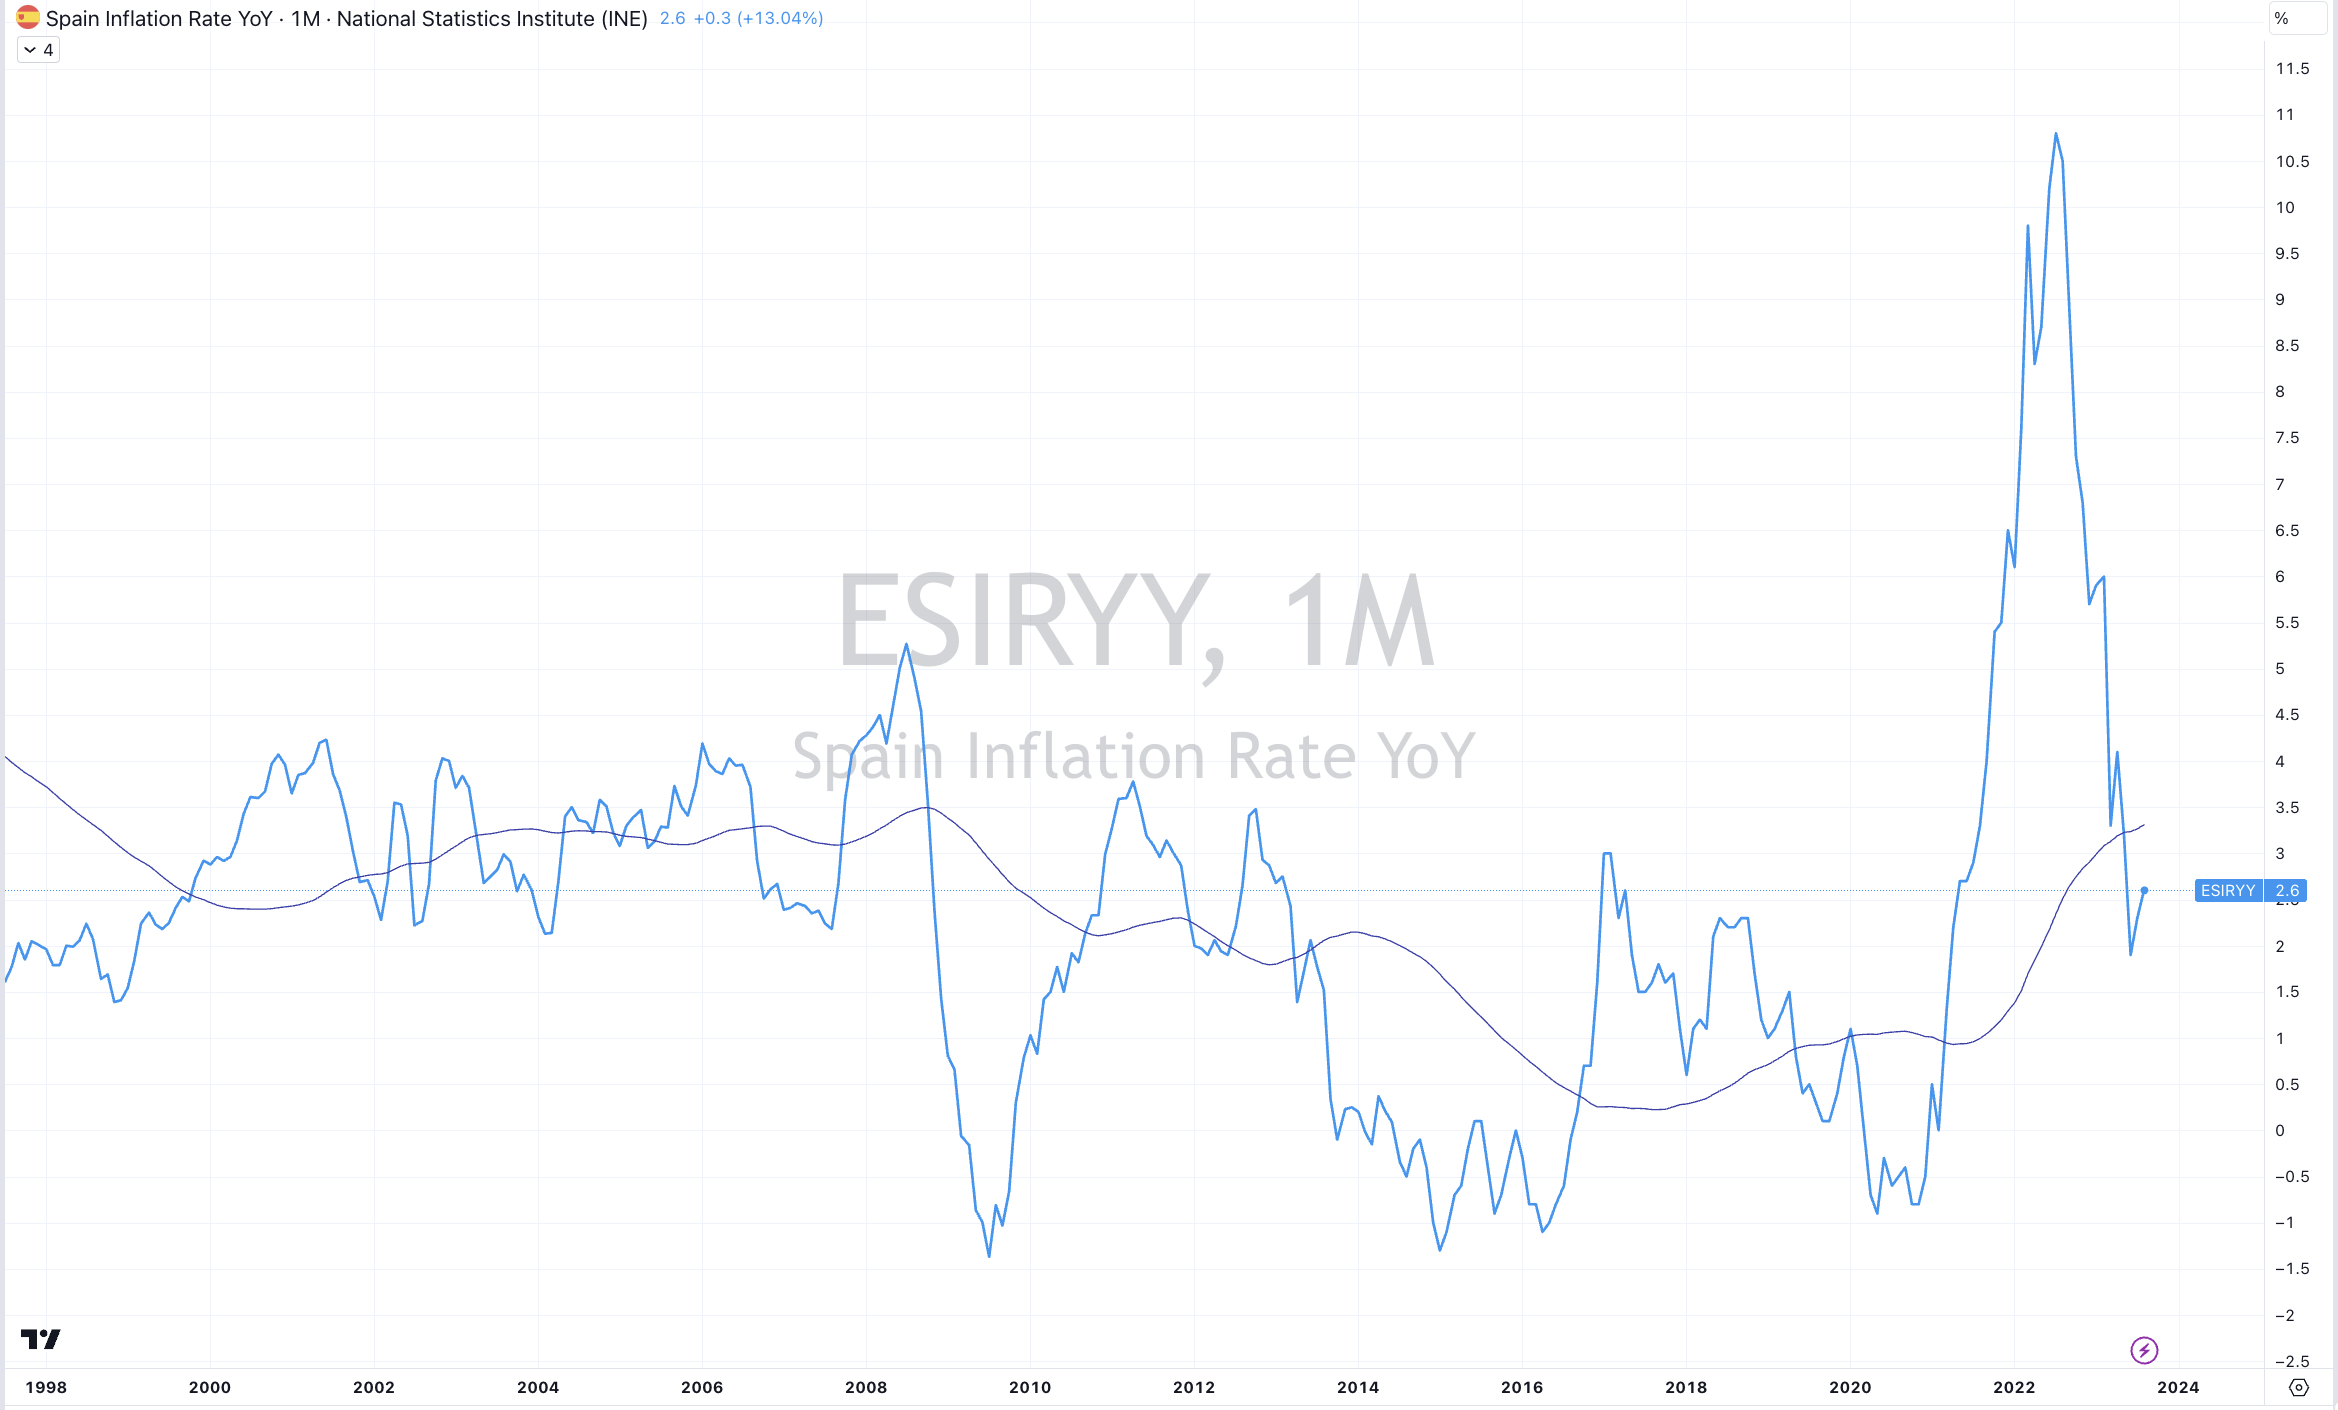
German, Swedish, Spanish and French 10 year government bond yields

TBT

LNG and JKM LNG 

Orange Juice 

CAD/AUD

Overbought (RSI > 70)

U.S. 3 month bill yields

Uranium

GBP/JPY

And Turkiye’s BIST 100

The Overbought Quinella – Both Overbought and Traded at > 2.5 standard deviations above the weekly mean)

U.S. 20 and 30 year government bond yields

CHF/AUD

Extremes “below” the Mean (at least 2.5 standard deviations)

LTLT

IDR/USD

INR/USD

Amsterdam’s AEX

and Stockholm 30 equity index

Oversold (RSI < 30)

Lithium

NZD/USD

The Oversold Quinella – Both Oversold and Traded at < 2.5 standard deviations below the weekly mean)

Chinese 10 year government bond yields

AUD/GBP

AUD/EUR

AUD/CHF

Notes & Ideas:

Equities broadly fell, for a 3rd week. This shouldn’t be a surprise for many indices appeared as ‘overbought’ within this newsletter in the preceding 4 weeks.

The declines amongst equities were sizeable. No equity indices amongst my universe rose during the past week.

Although, European and American indices fell as much, if not more than Chinese counterparts, which would be contrary to how the financial media framed it.

The Nasdaq Composite is at its lowest close since 10 weeks ago, while Helsinki’s OMX 25 Index is very near an oversold reading.

The SOX has sunk 10.5% in the past 3 weeks weeks, while the the Nasdaq has fallen 7.3% and the China’s CSI 300 eased 5.7% over the same timeframe.

And finally, the ASX Small Caps fell less than others.

Commodities were mixed.

Oil and Gas were generally weaker, with the exception of the bounce seen in LNG.

Incidentally, JKM LNG has risen 36% over the past 2 weeks.

Some metals saw weakness, yet Uranium is overbought.

Agricutural’s caught a bid, while Coffee is nearing oversold territory

WTI Crude and Gasoil saw their 7 week winning streak come to an end.

Heating Oil continues its rising run to its 8th week while Silver is in a 5 week losing streak.

In currencies, the AUD was weak everywhere again and is in its 5th week of losses versus the USD.

The AUD/EUR and the AUD/GBP pairs saw their lowest closing prices since April 2020.

And there are many streaks abound….

Amongst weekly losing streaks, the AUD/EUR is in its 9th, the SEK/USD is at 5 weeks, as is the EUR/USD and the CAD/USD, the AUD/CHF is at 9 weeks and the CLP (Chilean Peso)/USD has declined for 7 consecutive weeks and 9 of it the past 10 weeks.

The winning streak favours the U.S. Dollar as referenced by the DXY Index in its 5 week winning tear.

Bond yields rose again albeit less than the media may have been implying. 

In fact, many yields are yet to make new new highs and in some case there are mixed signals, such as the U.S. 7’s and 10’s which have reached a new weekly closing high but they haven’t broken the intra-week highs seen in October 2022.

Brazilian, Japanese and New Zealand bond yields rose the most. For example (week over week), Brazilian 10’s moved from 10.77% to 11.20%, JGB’s rose from 0.59% to 0.63% and Kiwi 10’s climbed from 4.87% to 5.05%.

Notably, longer dated U.S. Treasuries are appearing in the overbought quinella category this week and a bunch of European 10 year bond yields are making their first visit to overbought territory since September 2022.

And Chinese 10 year yields are at their lowest close since April 2020.

The larger advancers over the past week comprised of;

Baltic Dry Index 9.6%, Cocoa 2.7%, Heating Oil 1.7%, Lumber 7.8%, JKM LNG in Yen 28%, Orange Juice 8.1%, Dutch TTF Gas 3.1%, Uranium 2.8%, Silver in AUD 1.7%, Oats 5.6%, Soybeans 3.5%, Wheat 2% and JKM LNG in USD climbed 25.9%.

The group of decliners included;

Brent Crude (2%), WTI Crude (2.8%), Cotton (4.9%), Coffee (4.9%), Lithium (4%), Natural Gas (7.9%), Nickel (2.5%), Palladium (3.8%), Gasoline (12.3%), Sugar (2.3%), Shanghai (1.8%), CSI 300 (2.6%), AEX (3.9%), KBW (5.6%), CAC (2.4%), DJ Industrials (2.2%), DJ Transports (3.1%), MIB (1.8%), HSCEI (6%), Hang Seng (5.9%), IBEX (1.8%), Bovespa (2.3%), Nasdaq Composite (2.6%), Kospi (3.4%), S&P MidCap 400 (3%), Nasdaq Biotech Index (2.2%), Nasdaq 100 (2.2%), Nikkei 225 (3.2%), Oslo (1.9%), Copenhagen (2.4%), Helsinki (2.2%), Stockholm (2.6%), Russell 2000 (3.5%), SMI (2.2%), S&P 500 (2.1%), STI (3.7%), TSX (2.9%), FTSE 100 (3.5%), ASX 200 (2.6%), ASX Small Caps (2.2%), KRE Index (6.4%), S&P SmallCap 600 (3.3%), Chile (2%) and Istanbul BIST 100 fell 2.6%.

August 20, 2023

by Rob Zdravevski

rob@karriasset.com.au