A weekly Macro, Cross Asset review of prices trading at extremes which may generate future investment ideas and opportunities.
The following assets (on a weekly timeframe) either registered an Overbought or Oversold reading and/or have traded more than 2.5 standard deviations above or below its rolling mean.
Extremes “above” the Mean (at least 2.5 standard deviations
Australian 2, 5 and 10 year government bond yields
Natural Gas
Gold as priced in CAD
EUR/JPY
EUR/GBP
Overbought (RSI > 70)
Japanese and Turkish 10 year government bond yields
Cocoa
Uranium
And Rubber
The Overbought Quinella – Both Overbought and Traded at > 2.5 standard deviations above the weekly mean)
Japanese 2 and 5 year government bond yield
Extremes “below” the Mean (at least 2.5 standard deviations)
Indonesia’s equity index
South Korea’s KOSPI
Nasdaq Biotech Index
And the ASX Industrials Index
Oversold (RSI < 30)
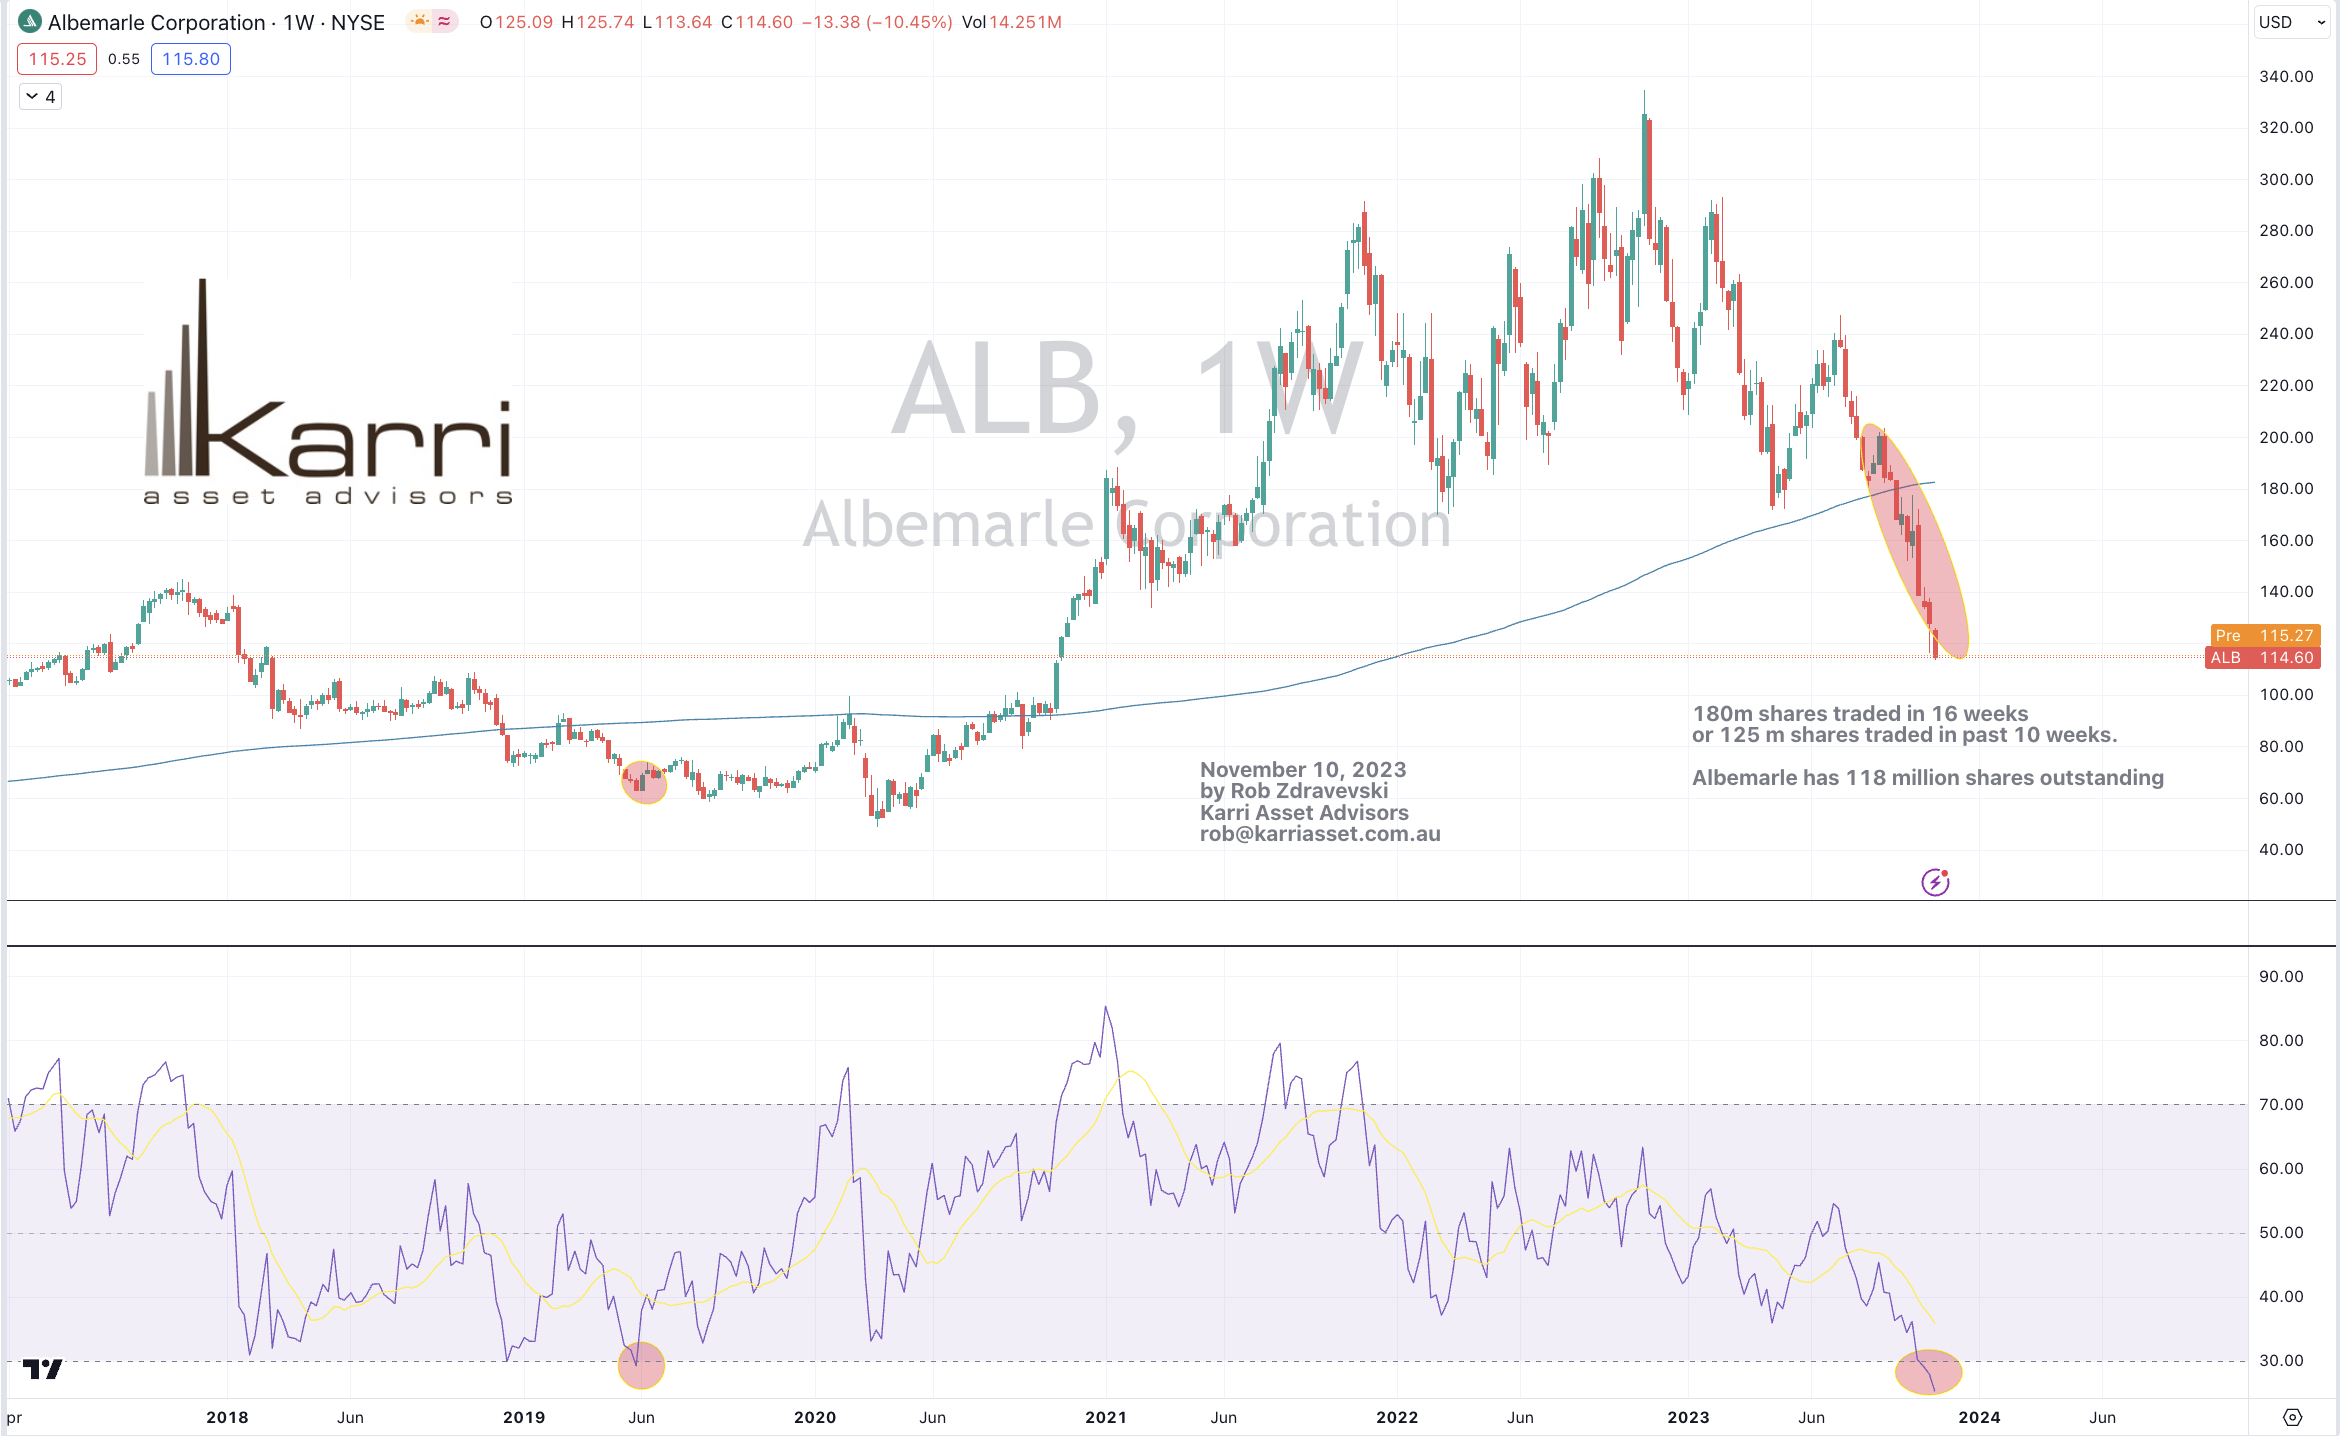
Lithium Hydroxide
Nickel
The Oversold Quinella – Both Oversold and Traded at < 2.5 standard deviations below the weekly mean)
None
Notes & Ideas:
Government bond yields lower again, except for the Japanese, again.
Bond yields peaked 2-3 weeks ago which coincided with many registering overbought extreme readings.
For example, over the past 2 weeks the Canadian 10 year bond was yielding 4.20% and today, it is 3.75%.
The U.S. 30 year bond was at 5.17% and now its 4.77%, while its 10 year counterpart has eased from 5.02% to 4.57%.
On the other side of that ledger the U.S. 7-10 Treasury Bond ETF (IEF) was trading at $89.20, 2 weeks ago.
It has risen 2.7% since then, with the ETF now at $91.60 per share.
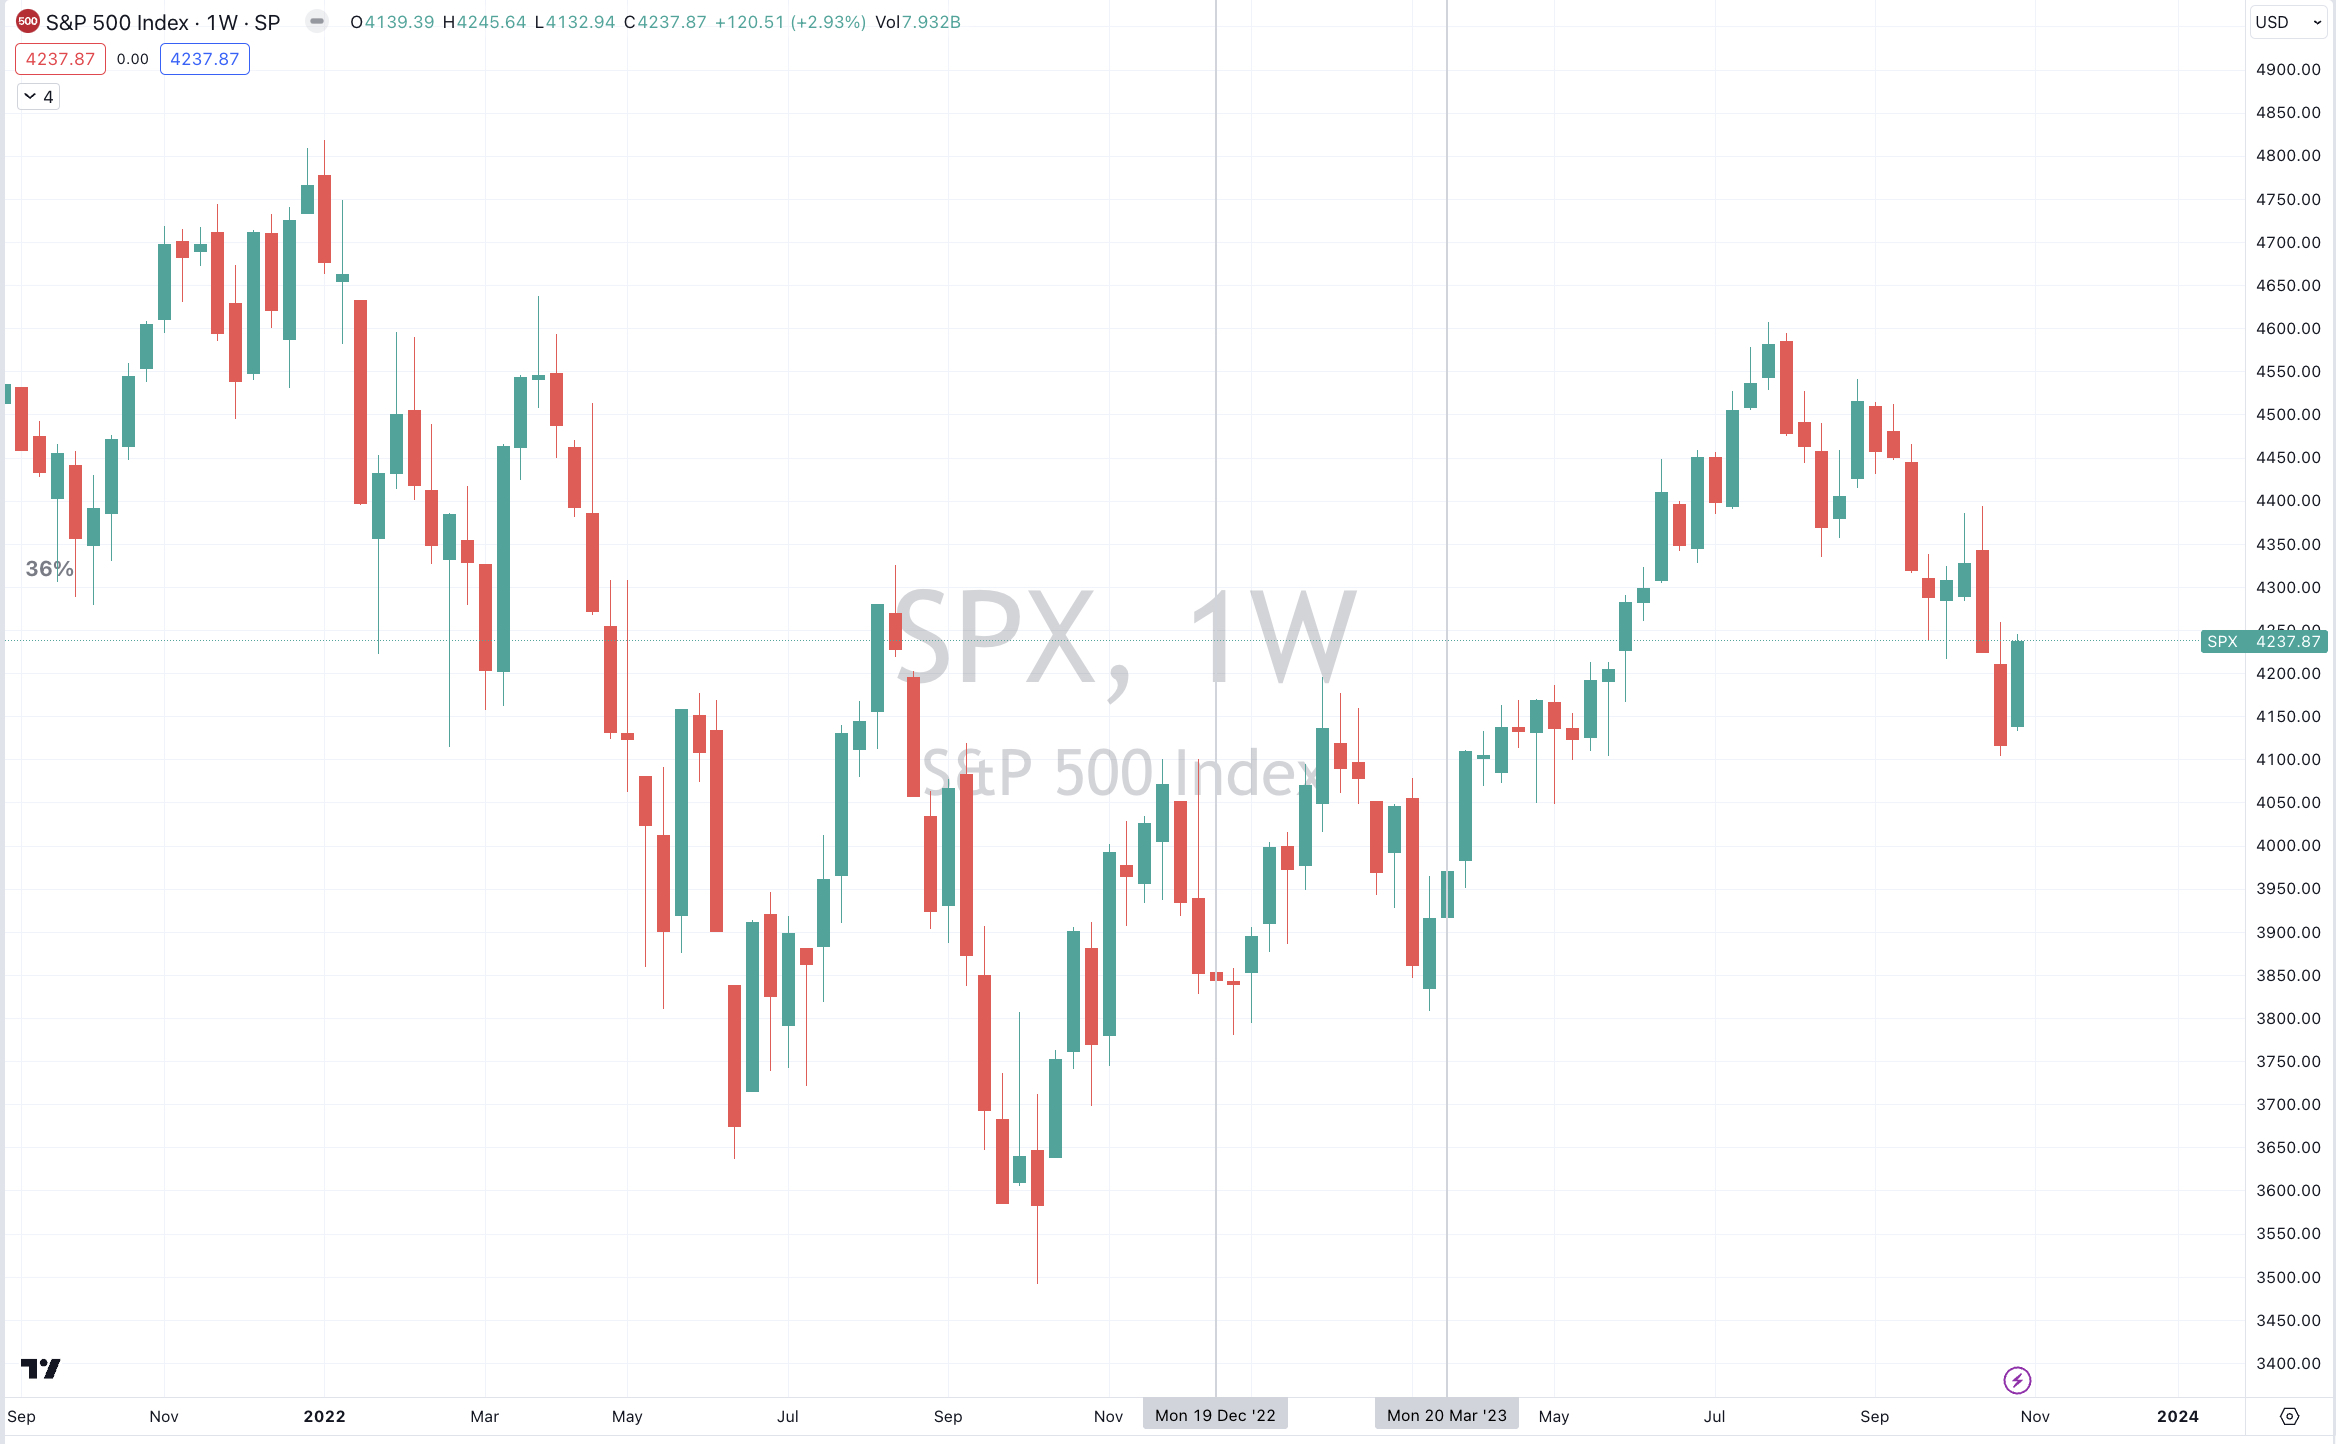
Equities surged.
The largest advancers for the week are listed at the end of this note.
The rise in equities wasn’t a surprise as foretold with my recent notes about excessive bearish sentiment.
Many equity indices which appeared in the oversold categories of this publication in the past 2 weeks are no longer so.
And there were those which also completed mean reversions down to their respective 200 week moving average.
All of those multi-week losing streaks mentioned last week have all been snapped.
Impressively, indices such as the S&P Small Cap 600 which had fallen 16.5% over the past 13 weeks, called 7.5% in this past week alone.
Lastly, the indices which appear in this week’s oversold extremes, did so earlier within the week.
Commodities were weaker, again.
The weakness amongst energy contracts (for the 2nd consecutive week) weighed heavily on commodity indices.
WTI Crude has closed at its lowest point since August 21, 2023.
Orange Juice fell 10.6% and it isn’t overbought anymore, while other agricultural prices held up.
Platinum rose while Gold declined. That gap still miles away from being closed.
Baltic Dry Index fell 7% adding to last week’s 24% drop. Prior to this slump, it put together a 7 week winning streak.
Heating Oil, WTI Crude and Gasoline have sunken 8%, 9% and 10%, respectively over the past fortnight.
Gold (as priced in CAD) took a break from 11% rally over the past 3 weeks.
Uranium remains overbought for an 12th consecutive week.
while Lithium Hydroxide declining streak extends to 17 consecutive weeks.
Amongst currencies, the Australian Dollar was stronger again, rising for the last 3 weeks against many pairs.
The Aussie’s most prominent rise was a 2.4% hike against the Swiss Franc.
The U.S. Dollar Index (DXY) was weaker and had a bearish outside week.
The Loonie was weaker, again, although strangely it has a bullish outside week against the USD.
The BRL/USD has risen for the past 4 weeks after having declined steadily for the past 3 months to complete its mean reversion.
The JPY/USD is still floating around the extremes as is the AUD/JPY.
And the Thai Baht has moved out of its oversold territory which it occupied a few weeks ago.
The larger advancers over the past week comprised of;
Lean Hogs 1.8%, Coffee 6.2%, Lumber 3.6%, Platinum 4.3%, Sugar 1.6%, Soybeans 2.4%, AEX 3.1%, KBW Bank Index 11.1%, CAC 3.7%, China A50 2.7%, DAX 3.5%, DJ Industrial 5.1%, DJ Transports 7.1%, MIB 5.1%, IBEX 4.2%, Bovespa 4.3%, S&P SmallCap 600 7.5%, Nasdaq Composite 6.6%, KRE Regional Bank Index 12.2%, KOSPI 2.9%, FTSE 250 6.6%, S&P MidCap 400 6.6%, Mexico 4.7%, Nasdaq Biotech Index 6.7%, Nasdaq 100 6.5%, Copenhagen 2.5%, Helsinki 4.5%, Stockholm 3.8%, Russell 2000 7.6%, SET 2.3%, S&P SmallCap Value 8.8%, SMI 2.5%, SOX 7.1%, S&P 500 5.9%, STI 2.7%, TAIEX 2.3%, TSX 5.8%, FTSE 100 1.7%, ASX 200 2.2%, ASX Industrials 3.8%, ASX SmallCaps 3.1% and the Nikkei 225 rose 3.1%.
The group of decliners included;
Australian Coking Coal (7.5%), Rotterdam Coal (4.2%), Baltic Dry Index (6.5%), China Coking Coal (11.6%), WTI Crude (5.9%), Cotton (5.6%), Heating Oil (4.2%), LNG JKM (5.9%), Lithium (6.8%), Tin (3.4%), Newcastle Coal (9%), Orange Juice (10.6%), Gasoline (4.1%), S&P GSCI (2.2%), Dutch TTF Gas (9.4%), Brent Crude (4.1%), Silver in AUD (2.3%), Gold in AUD (3.4%), Gold in CAD (2.2%), Oats (7.5%), Rice (2.2%).
November 5, 2023
by Rob Zdravevski
rob@karriasset.com.au