A weekly Macro, Cross Asset review of prices trading at extremes which may generate future investment ideas and opportunities.
The following assets (on a weekly timeframe) either registered an Overbought or Oversold reading and/or have traded more than 2.5 standard deviations above or below its rolling mean.
Extremes “above” the Mean (at least 2.5 standard deviations
SHY – 1-3 year Treasury ETF
Rice
BOVESPA
Overbought (RSI > 70)
Turkish 10 year government bond yields
Cocoa
Rubber
Uranium
EUR/JPY
The Overbought Quinella – Both Overbought and Traded at > 2.5 standard deviations above the weekly mean)
GBP/JPY
Extremes “below” the Mean (at least 2.5 standard deviations)
Chilean 2 year government bond yields
British 5 year government bond yield
Swiss and British 10 year government bond yields
Cattle
Oversold (RSI < 30)
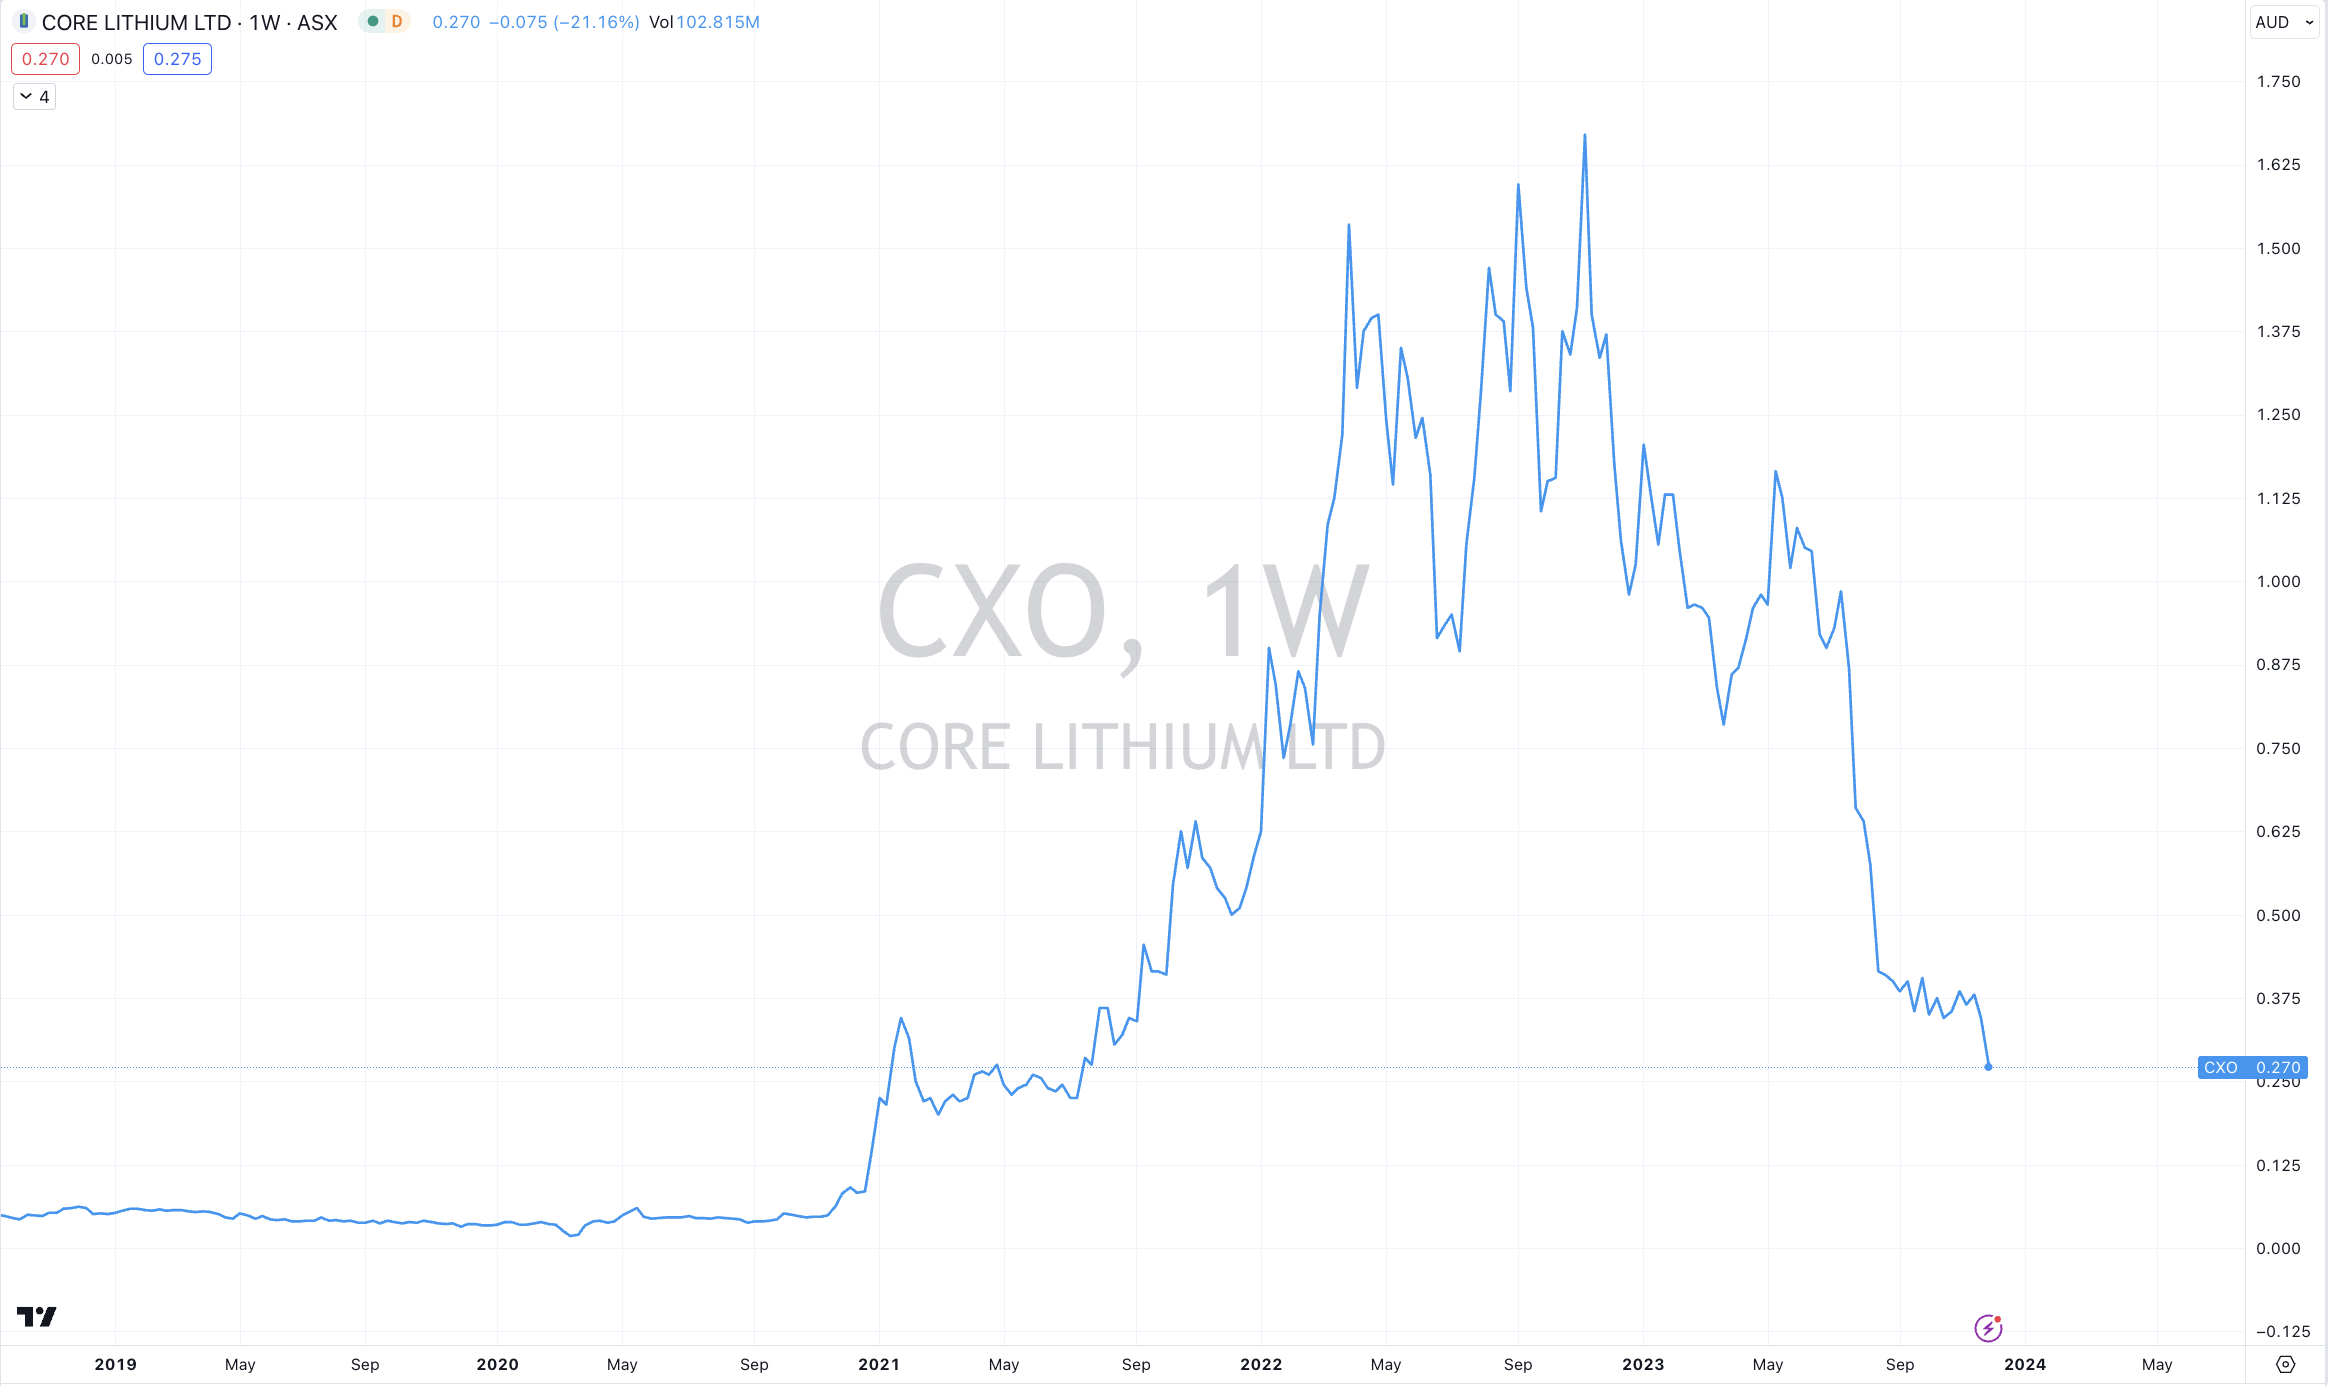
Lithium Hydroxide
Nickel
The Oversold Quinella – Both Oversold and Traded at < 2.5 standard deviations below the weekly mean)
None
Notes & Ideas:
Government bond yields rose slightly.
The TLT ETF broke its 4 week winning streak.
While we saw a slight rise oil yields this past (shortened trading) week, I continue to highlight many have fallen for the past 4-6 weeks and remain below the highs being recently heralded.
So much so, 6 weeks ago, the price of the IEI ETF was $112 and now is trading at $114. That’s a 1.8% capital gain, while not including the 0.45% in dividends (coupons) paid over that time.
Other misnomers and surprises include the BoA 5-7 year corporate bond yield is hovering at the same yield as September 4, 2023 and the same as November 7, 2022 and as previously seen on September 19, 2022.
British yields are flirting with a drop into oversold territory.
And as prompted in last week’s edition, Swiss 10 year government bond yields did enter oversold territory this week.
Equities experienced a diverse week, with several indices ending near last week’s closing prices, showing marginal fluctuations of within +/- 1%. Advancing stocks slightly outnumbered declining ones during this period.
The following indices have risen for 4 consecutive weeks; DAX, DJ Industrials, Nasdaq Composite and the 100, KOSPI, Nikkei 225, Sensex, Copenhagen, S&P 500 and the TAIEX.
Brazil’s BOVESPA and the IPC Mexico Index are in a 5 week winning streak. The former appearing in this weeks overbought category.
The KOSPI has risen 8% in the past 4 weeks following it registering an oversold extreme.
The Nasdaq Transports and the Composite have advanced 11% and 12%, respectively, over the same time.
The ASX 200 rose 0.1%, the ASX Materials climbed 0.2%% while the ASX Small Caps and ASX Industrials fell 0.9% and 0.8% respectively.
And India’s SENSEX seems to be amongst the most extended of bourses, for it trades at 24% above its 200 week moving average.
Commodities were generally flat to weaker, with the commodity indices being influenced by the larger weighting of the energy contracts.
In fact, the S&P GSCI Index has fallen for 5 consecutive weeks.
WTI Crude, Brent Crude, Gasoline and Nickel are sporting 5 week losing weeks.
WTI Crude is at its lowest weekly closing price since early July 2023. So much for geopolitical risks affecting the Oil price??
Inversely, Lumber is in a 5 week winning streak as is the Copper/Gold Ratio.
Orange Juice fell 1% which was enough to shift it out of overbought territory, although mean reversion to its 200 week moving average beckons.
Natural Gas has slumped 20% over the past 3 weeks.
The Baltic Dry Index has soared 38% in the past 3 weeks.
Oats were in the oversold category 2 weeks ago. This past week, their price soared 13% higher. ,
Cocoa broke its 7 week winning streak and similar to Orange Juice, mean reversion risk lies below.
Uranium remains overbought for an 15th consecutive week.
Lithium Hydroxide declining streak extends to 20 consecutive weeks,
Last week’s note that Silver had a bullish outside week saw it follow through with a 2.6% gain this week.
Gold as priced in AUD has declined for each of the past 4 weeks
And I see price digestion in the (softs) agricultural’s.
Amongst currencies, the Australian Dollar was stronger again.
The AUD/USD closed at its highest levels since late July 2023.
The AUD/JPY is nearly overbought, while the AUD/ZAR soared 3.5%.
EUR/JPY is at its highest close since August 4th, 2008.
The Yen was weaker everywhere.
The Canadian Loonie was mixed. It was weaker versus the AUD & GBP….and stronger against the EUR & USD.
And I’m reflecting about the August 19, 2023 high seen in the AUD/CHF and if it coincided with a peak in ‘risk-on’ sentiment.
The larger advancers over the past week comprised of;
Baltic Dry Index 15.5%, China Coking Coal 4.5%, Gasoil 2.4%, Copper 1.5%, Heating Oil 2.2%, Lumber 2.6%, Newcastle Coal 3.1%, Palladium 2.1%, Rubber 1.6%, Dutch TTF Gas 3.5%, Uranium 3.3%, Silver USD 2.6%, Oats 13%, DJ Industrials 1.3%, IBEX 1.8%, Oslo 1.5%, Stockholm 1.4%, SMI 1.3%, S&P 500 1% and the Nasdaq Transports rose 1.4%.
The group of decliners included;
WTI Crude (1.2%), Lean Hogs (4.3%), Cattle (3%), LNG JKM in Yen (3.8%), Lithium Hydroxide (1.7%), Tin (2.9%), Natural Gas (3.6%), Nickel (4.6%), KRE Regional Bank Index (1.8%) and Thailand’s SET Index fell 1.3%.
November 26, 2023
by Rob Zdravevski
rob@karriasset.com.au
Happy Birthday Mama !