Macro Extremes (week ending October 1, 2021)
October 2, 2021 Leave a comment
The following assets (on a weekly timeframe) registered an Overbought reading or traded more than 2.5 standard deviations above its rolling mean.
Extremes “above” the Mean (at least 2.5 standard deviations)
U.K. 10 year government bond yields (Gilts)
U.S. 2 year and 5 year govn’t bond yields
The Bloomberg Commodity Index
And the USD/JPY (telling us the Yen is weak)
Overbought (RSI > 70)
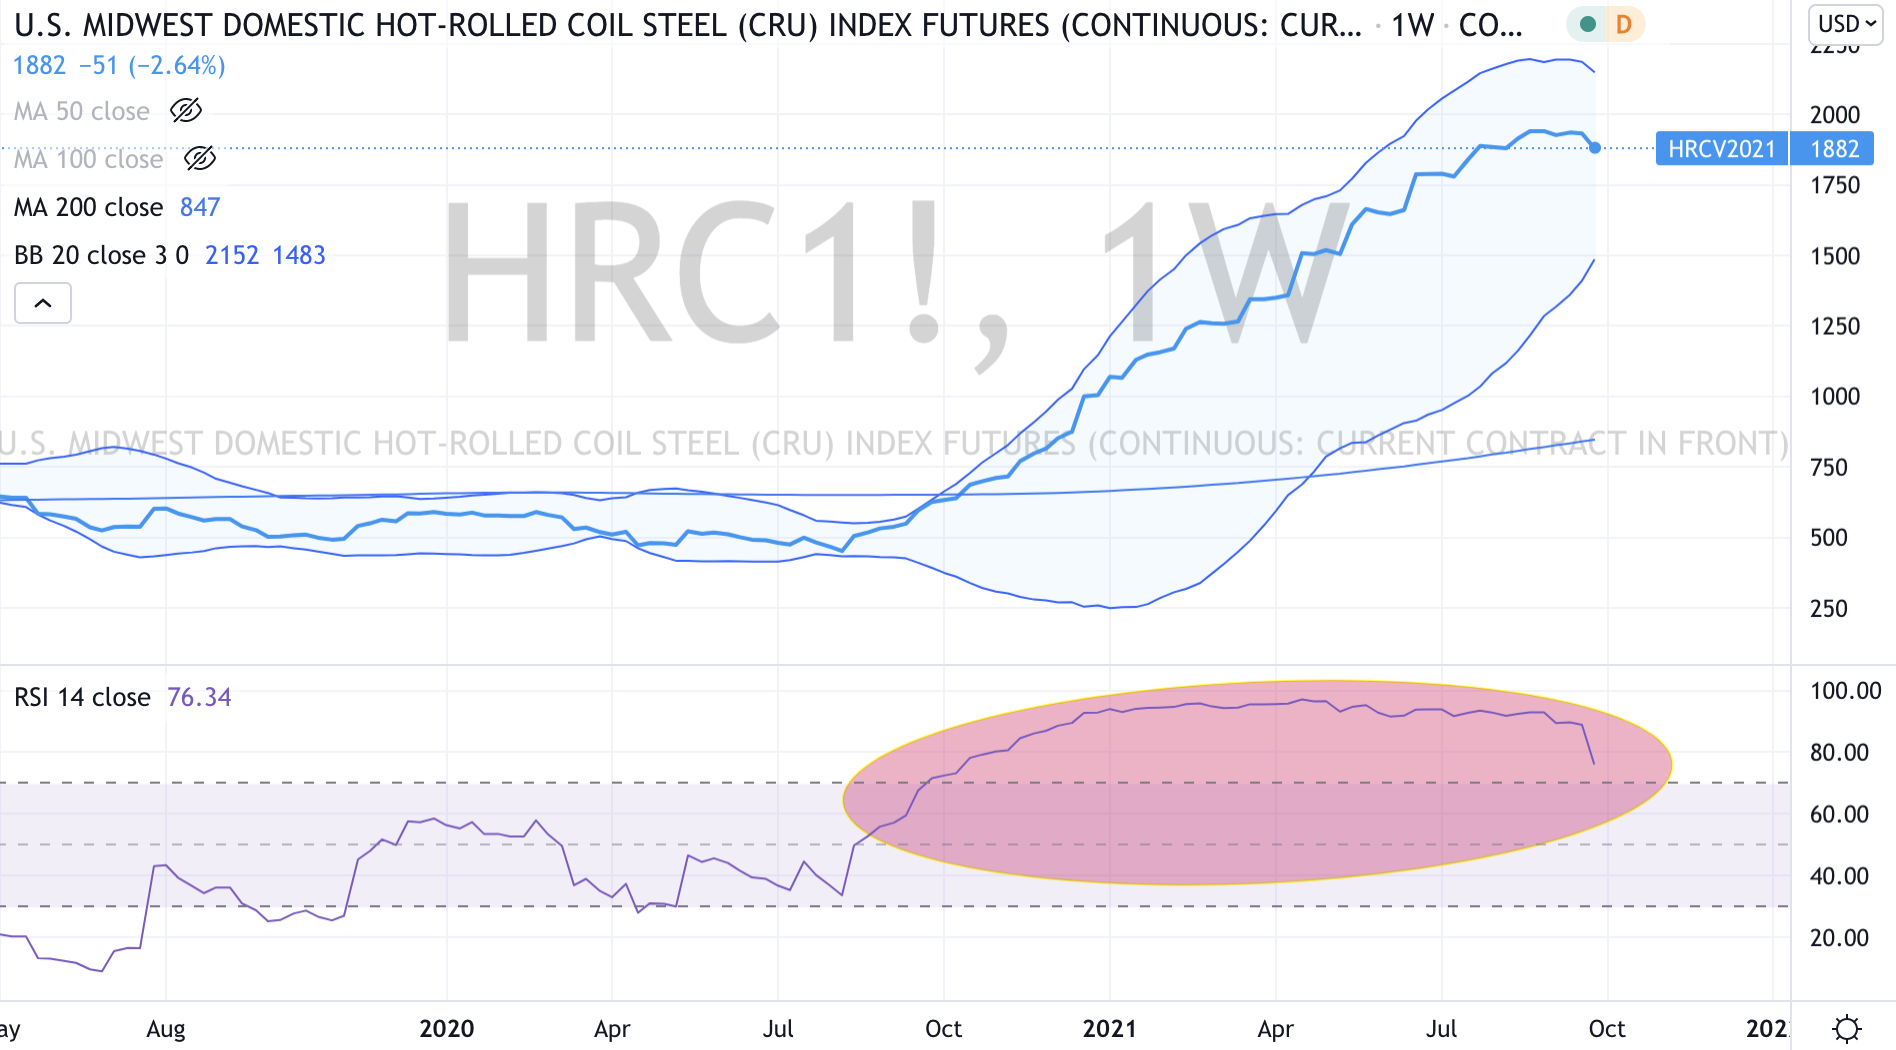
Hot Rolled Coil Steel (for the 53rd consecutive week)
Coffee
Tin
The CRB Index
and India’s Sensex & NIFTY 50 equity indices
The Overbought Quinella – Both Overbought and Traded at > 2.5 standard deviations above the weekly mean)
Gasoil
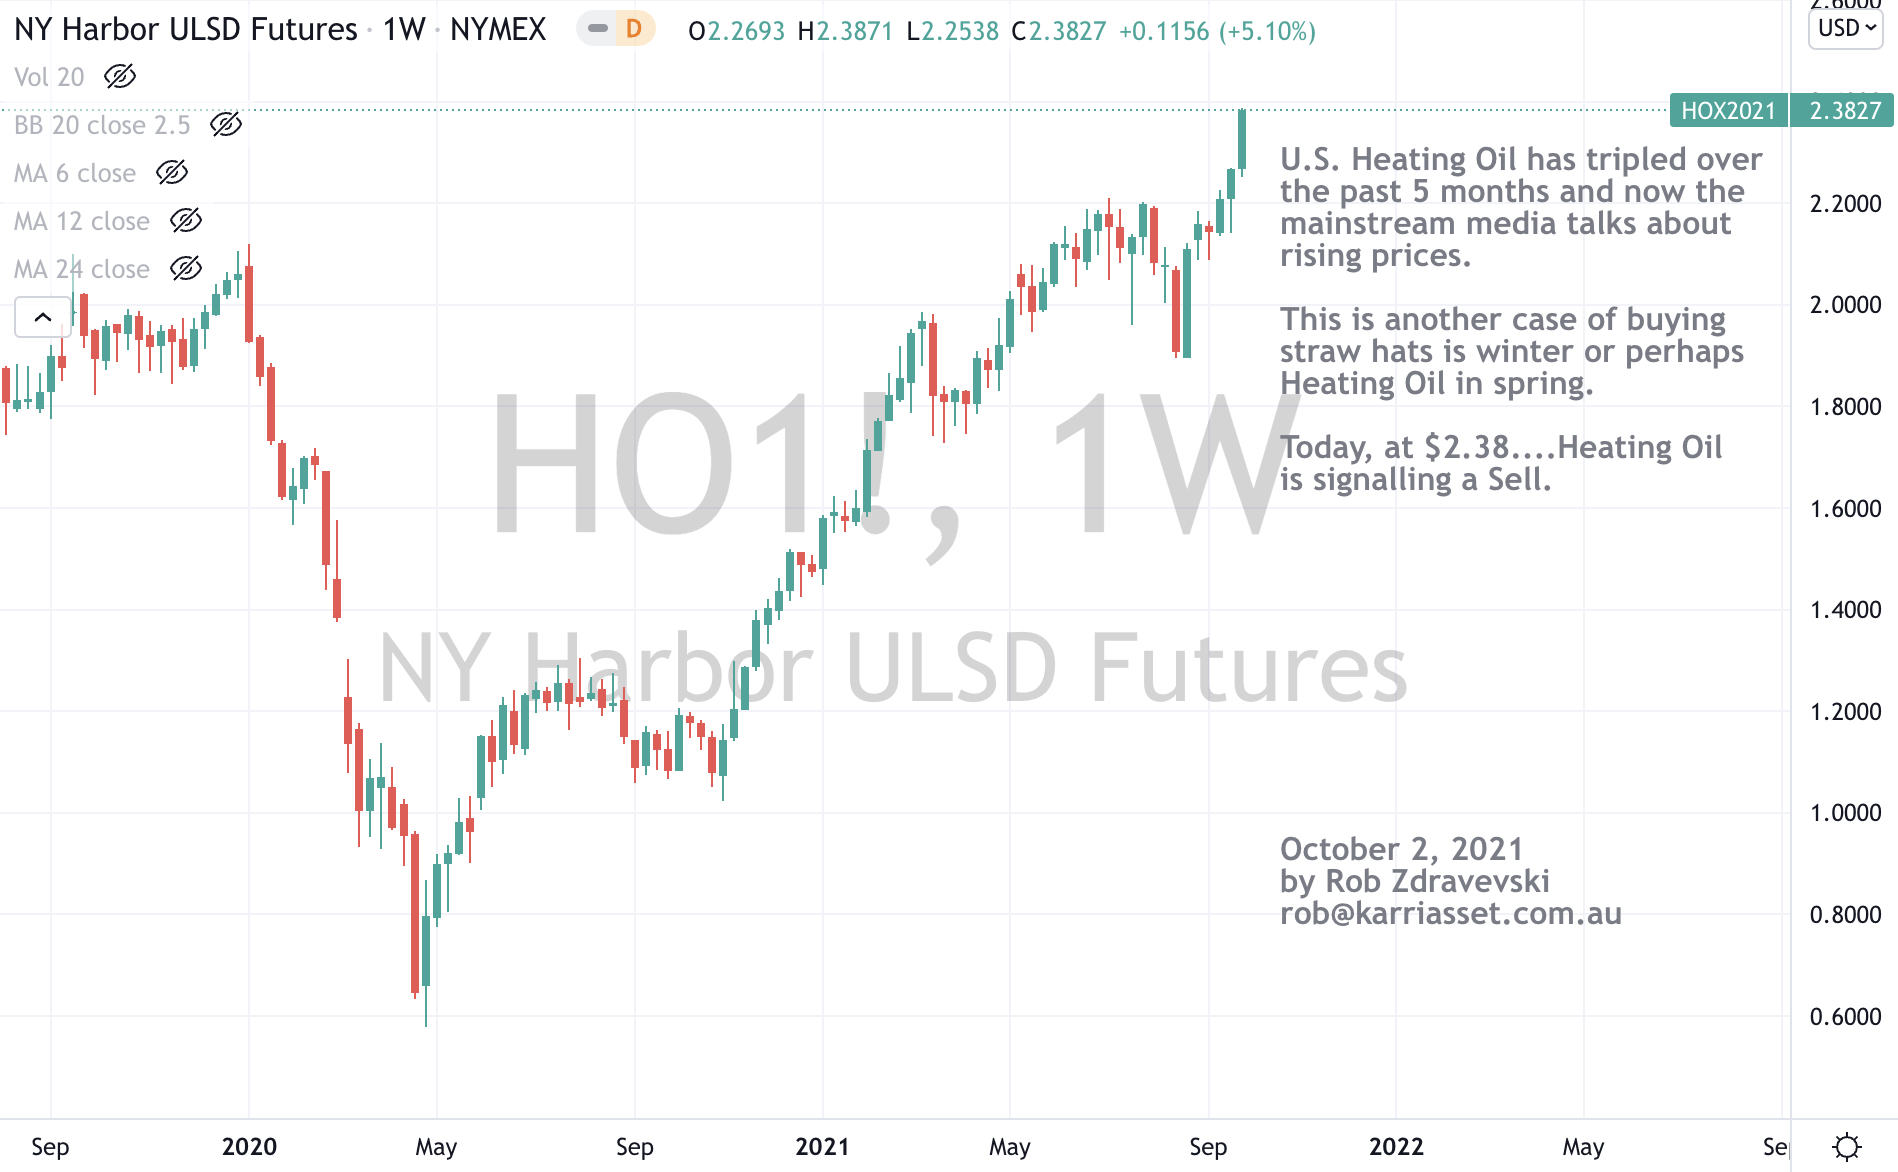
Heating Oil
Baltic Dry (shipping) Index
Natural Gas
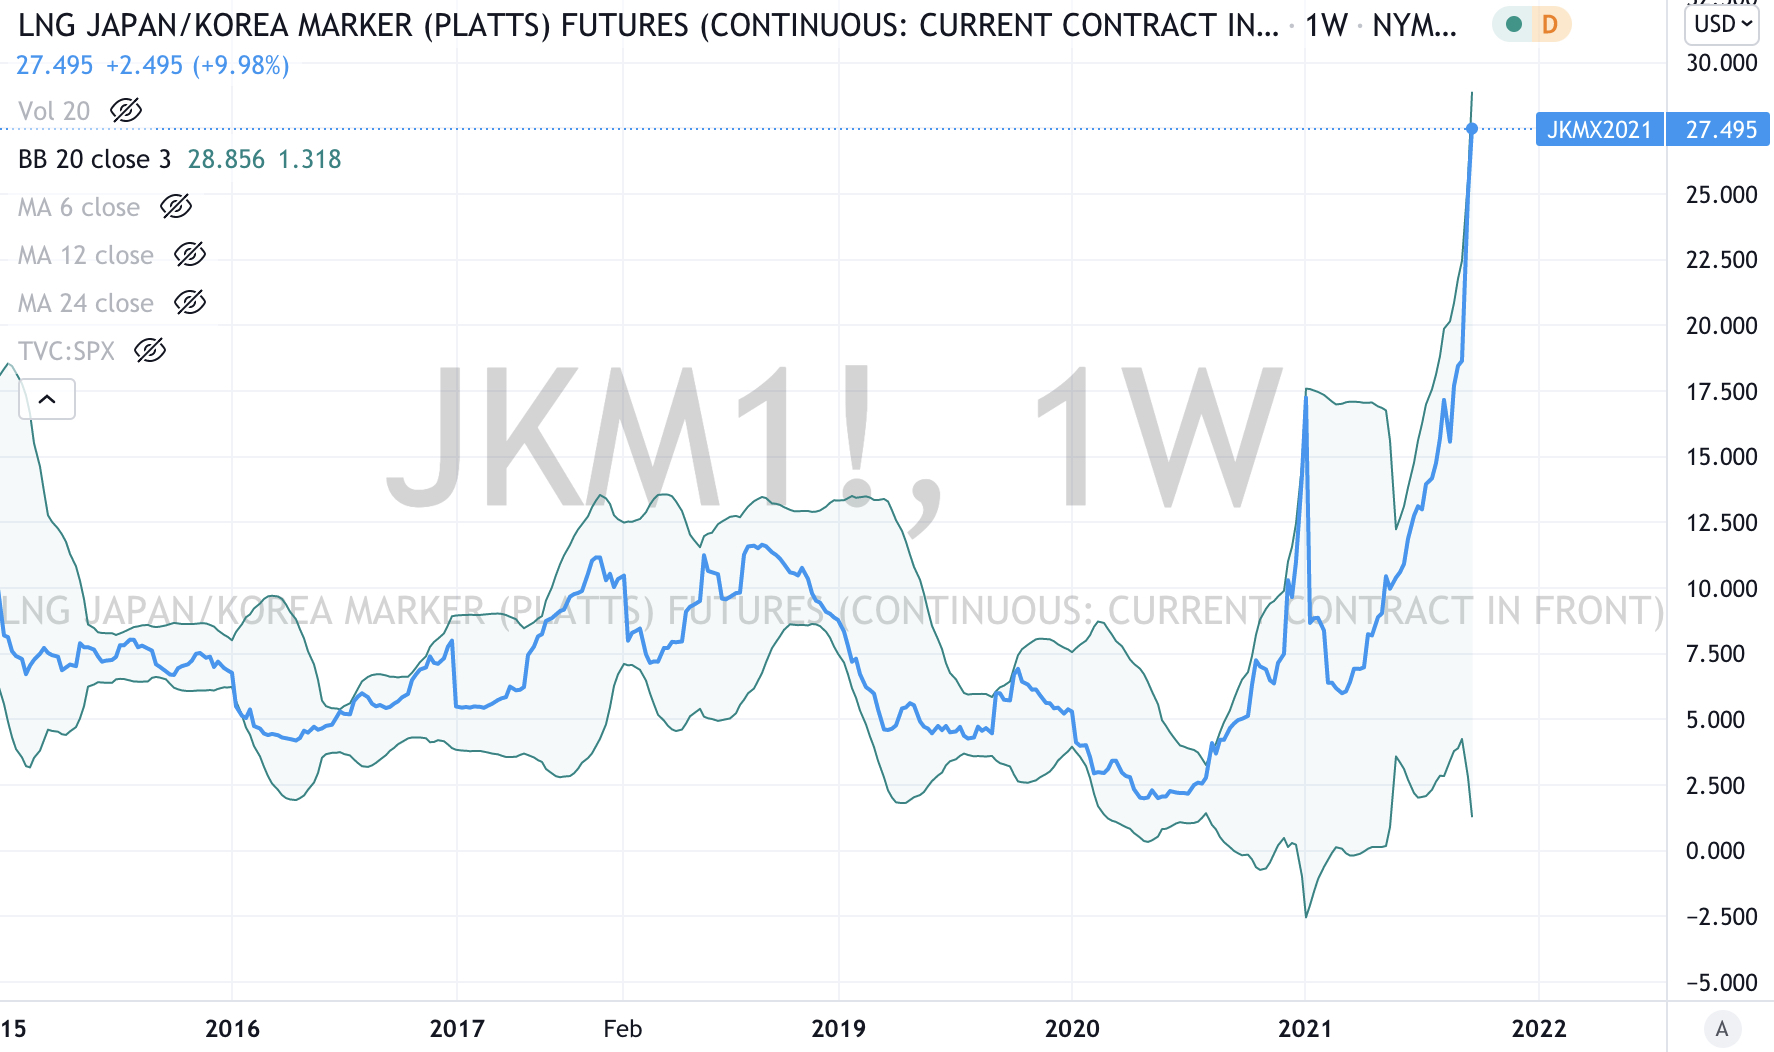
And the JKM “Japan/Korea (LNG) Marker”
Assets (securities) which touched the other side of the extreme, being Oversold (where the RSI is < 30) or were at least 2.5 standard deviations below its mean are;
Extremes “below” the Mean (at least 2.5 standard deviations)
Germany’s DAX
South Korea’s KOSPI equity index
GBP/USD (meaning the British Pound has weakened)
Oversold (RSI < 30)
None
The Oversold Quinella – Both Overbought and Traded at > 2.5 standard deviations above the weekly mean.
None
Notes & Ideas:
The price action remained the bond market this past week with commodities also featuring the larger movers amongst the list below.
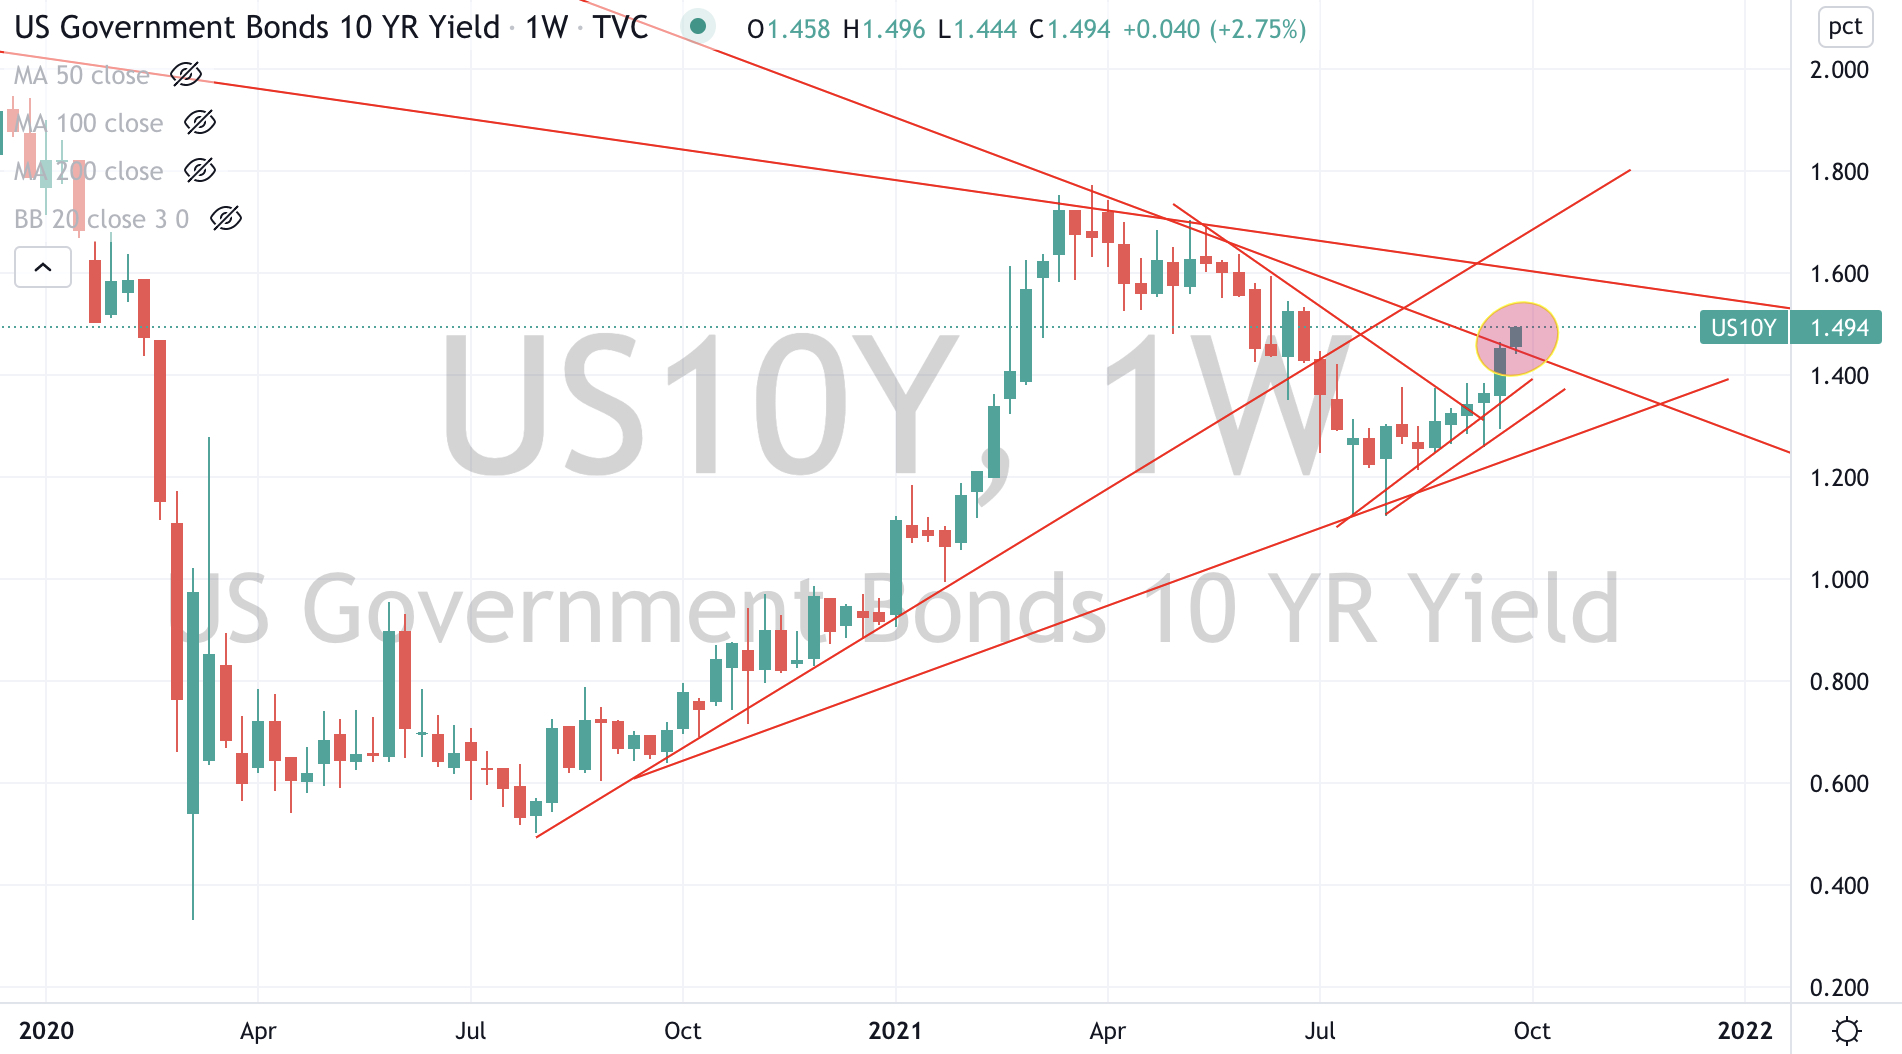
Bond yields have been rising. Following from last week’s round-up of movers over the past 2 weeks, we take a look at the past 6 weeks movers in yields.
Australian 10’s have risen from 1.07% to 1.49%.
U.S. 10’s from 1.13% to 1.47%
French 10 years from -0.15% to + 0.12%
U.K. 10’s have doubled from 0.52% to 1.01%. This weeks high was 1.06%.
Japanese 10’s are climbing, Korean 10’s are nearly overbought while the US10 year minus US2 year spread is on the verge of forming a bullish trend which is another indicator of stock market risk.
I am also watching the Copper/Gold Ratio to also assist with a directional call on interest rates and the USD (DXY) Index is above 94.
The larger advancers over the past week comprised of Baltic Dry Index (shipping) 12% (it’s up 30% in past 3 weeks), WTI crude 2.6%, Cocoa 4.6%, Iron Ore 6.7%, Gasoil 2.7%, Heating Oil 5%, JKM 13%, Coffee 5% (adding to last week’s 4.2% advance), Natural Gas 9.3%, Gasoline 2.9%, Sugar 5%, the CRB Index 2.2%, Corn 2.8%, Wheat 4.4% & the U.S. KBW Banking Index rose 2.4%, adding to last week’s 3% rise.
The group of decliners included Aluminium (2.4%), Cattle (2%), Nickel (5.3%), Orange Juice (3.6%), Rice (2%), Soybean (3%), AEX Index (3.1%), CAC-40 (2%), DAX (2.4%), S&P 500 (2.2%), TAEIX (4%), OMX Stockholm (2.6%), OMX Helsinki (2.3%), OMX Copenhagen (5.5%) (remember the Overbought signals on these in the last month), India’s Sensex (2.1%), Nasdaq (3.5%), the Nikkei tumbled (4.9%) and SOX fell (5.5%).
Note: the Philadelphia Semiconductor Index (SOX) has been generally trading sideways for 4 months and is the same price at February 2021. This somewhat validates the thinking that when the semiconductor shortage story hit mainstream, it was already built into the stock prices. The SOX has tripled from its March 2020 low and has risen 8-fold since January 2016.
Heating Oil has soared 23% in a month and as the chart below illustrates, has tripled since April 2021, when it last flashed an ‘extreme’ buy signal. Today, my signals for Heating Oil suggest selling.
A rise in the U.S. Dollar has generally resulted in weaker commodity prices. Gold in AUD continues to hold a A$2,312 support level.
But I continue to watch and think that recent rise in interest rates will be a head-fake and lead to a reversal lower. The next resistance in U.S. 10’s is 1.62%.
Higher U.S. interest rates means a rising AUD. If 10’s hit resistance and reverse lower, the lower AUD and weaker commodities trade is back on.
October 2, 2021
by Rob Zdravevski
rob@karriasset.com.au