The following assets (on a weekly timeframe) registered an Overbought or Oversold reading and/or have traded more than 2.5 standard deviations above or below its rolling mean.
Extremes “above” the Mean (at least 2.5 standard deviations)
Brazil 10 year government bond yields
Overbought (RSI > 70)
U.S. Dollar Index
The Overbought Quinella – Both Overbought and Traded at > 2.5 standard deviations above the weekly mean)
None
Extremes “below” the Mean (at least 2.5 standard deviations)
Copper/Gold Ratio
Corn
Oats
Soybeans
Oversold (RSI < 30)
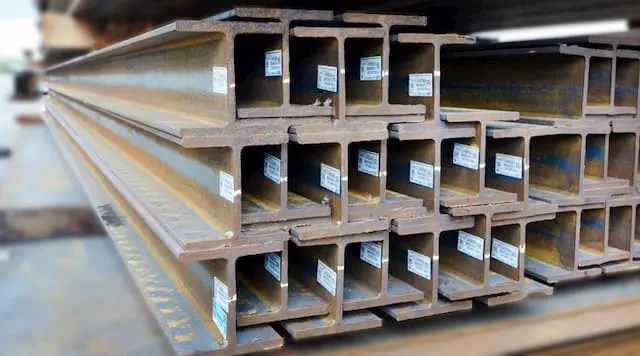
Hot Rolled Coil Steel
Bitcoin (incl GBTC)
Ethereum
JPY/USD
GBP/USD
KRW/USD
INR/USD
SEK/USD
IDR/USD
The Oversold Quinella – Both Overbought and Traded at > 2.5 standard deviations above the weekly mean)
South Korea’s KOSPI equity index
Taiwan’s TAEIX equity index
Copper
Tin
Chilean Peso / U.S. Dollar
Notes & Ideas:
This week’s biggest news was that no developed world bond yields appeared in the Overbought extreme section. After some weeks of appearing on this publication, yields eased across the board.
Over the past 2 weeks, we saw German yields fall from 1.92% to 1.23%, Australian 10’s declined from 4.25% to 3.47%, U.K. Gilts eased from 2.74% to 2.10%, JGB’s have nearly halved from 0.42% to 0.21%, Swedish 10’s fell from a yield of 2.18% towards 1.54% and U.S. 2’s moved from 3.45% to 2.84% while the 10’s fell commensurately from 3.50% to 2.89% and the yield curve is yet to invert.
The carnage of bond losses is offering some reprieve to those recent buyers.
The other news is the continued decline in commodity prices.
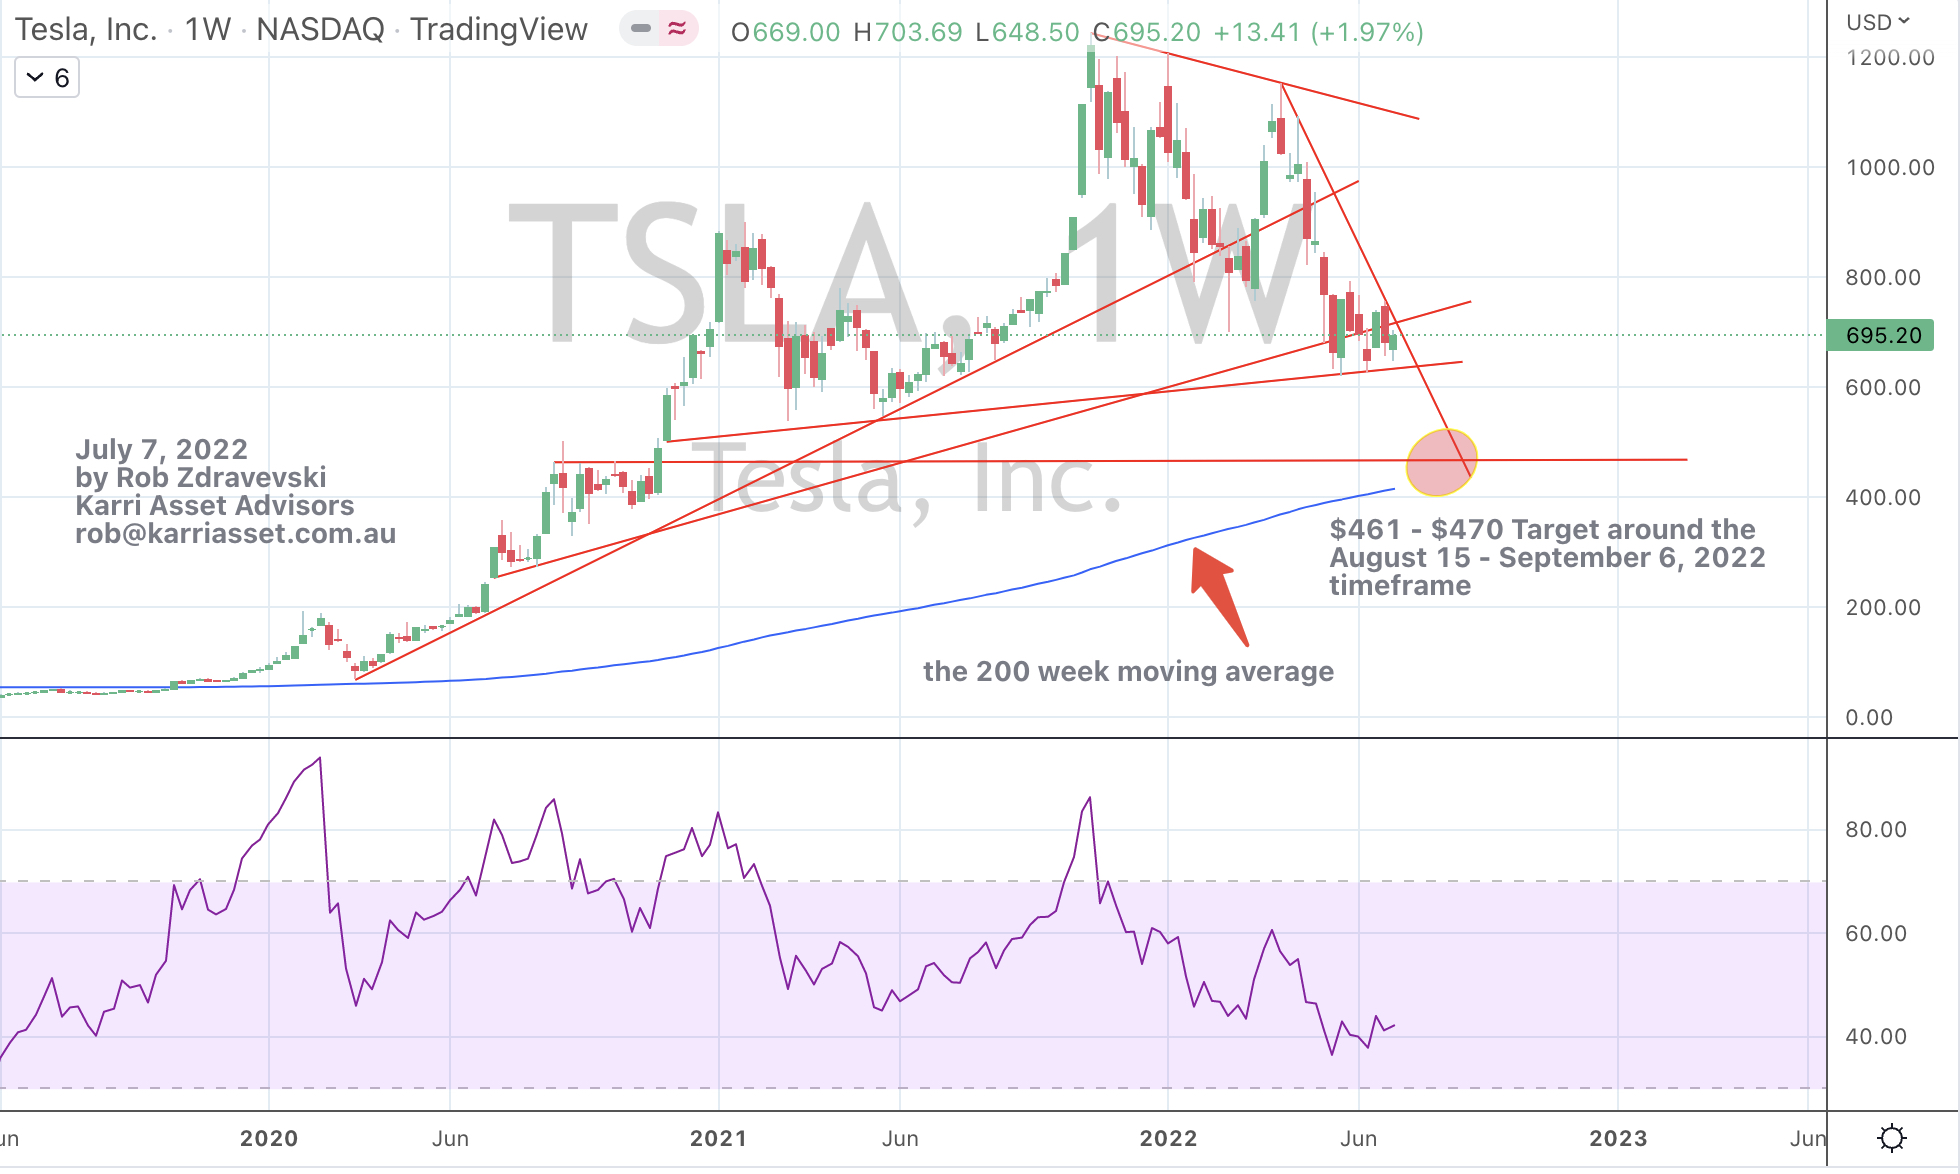
Silver fell heavily enough that it touched its 200 week moving average.
Coal, Aluminium, Cocoa, Iron Ore and Platinum are nearing a ‘buying zone’, as is the Philadelphia Semiconductor Index which has tanked 40% from its New Year Day’s high.
Silver may be an interesting buy at US$18.65, more work to be done.
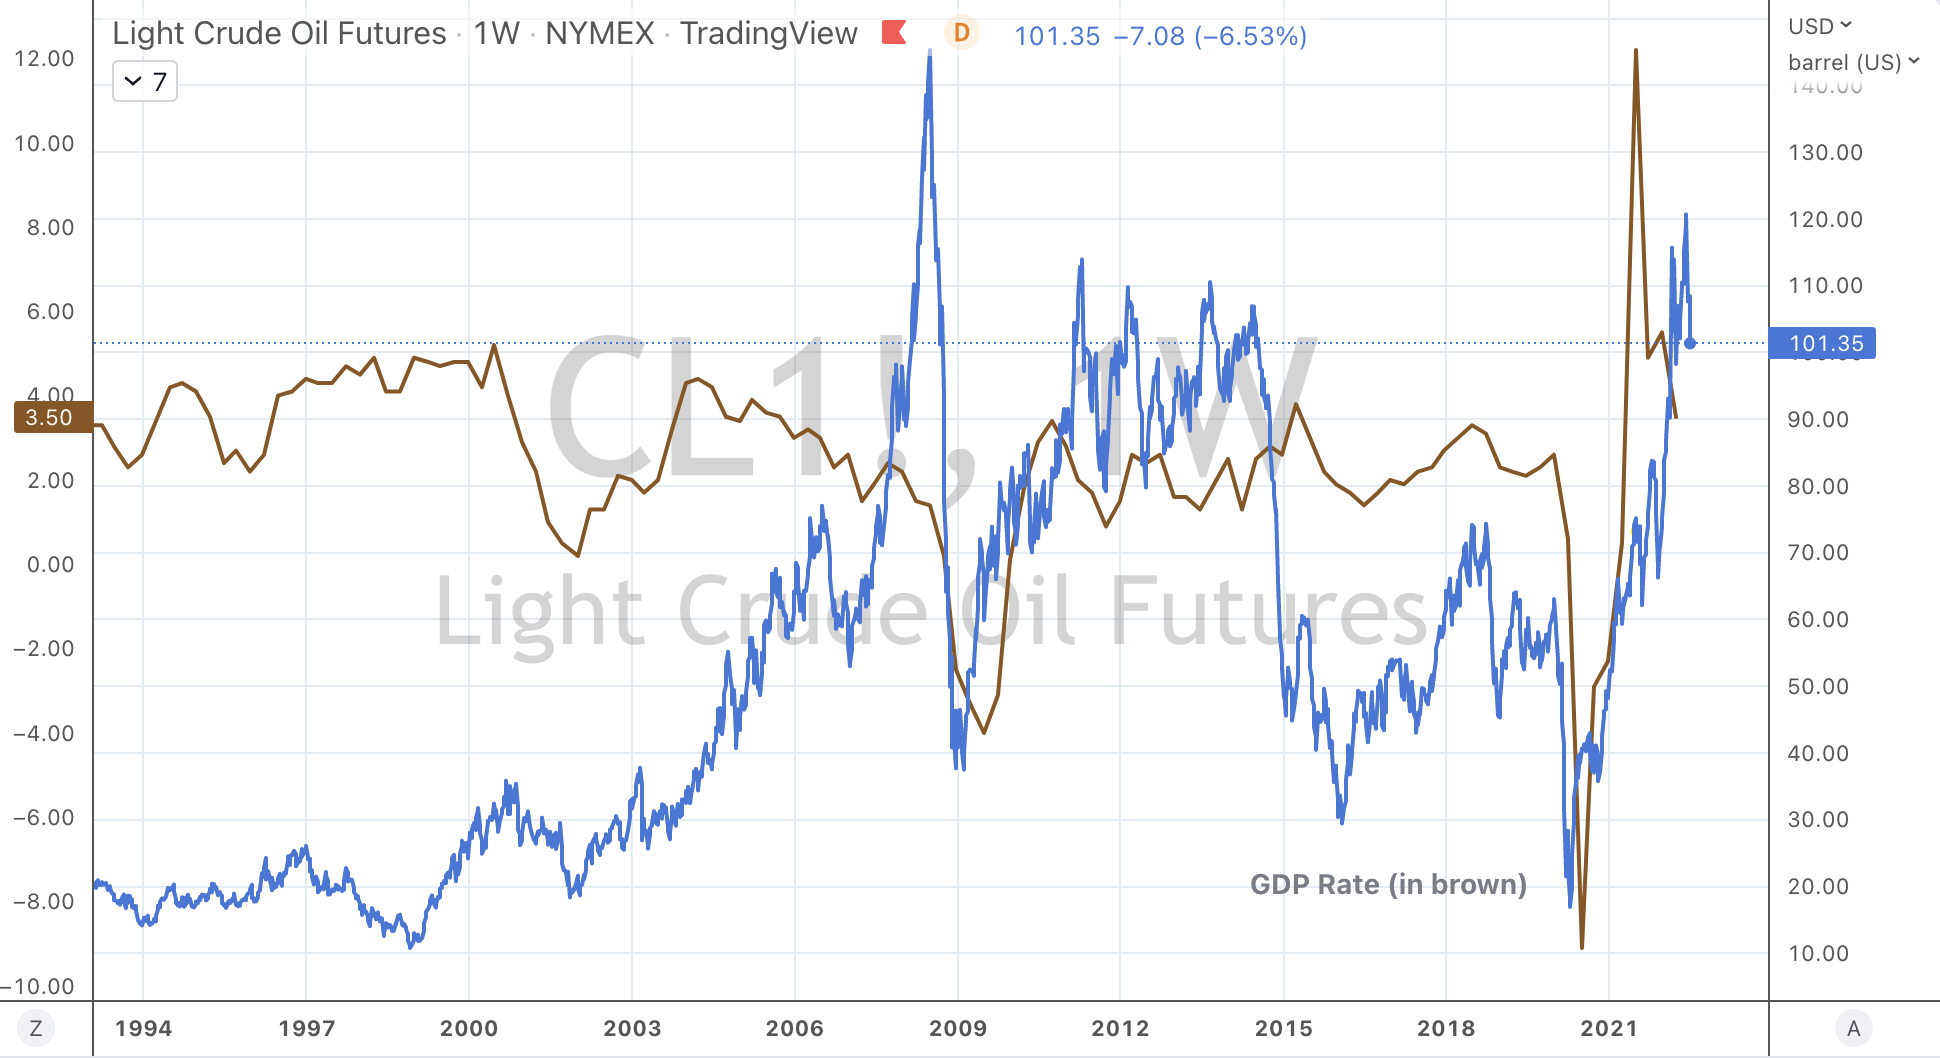
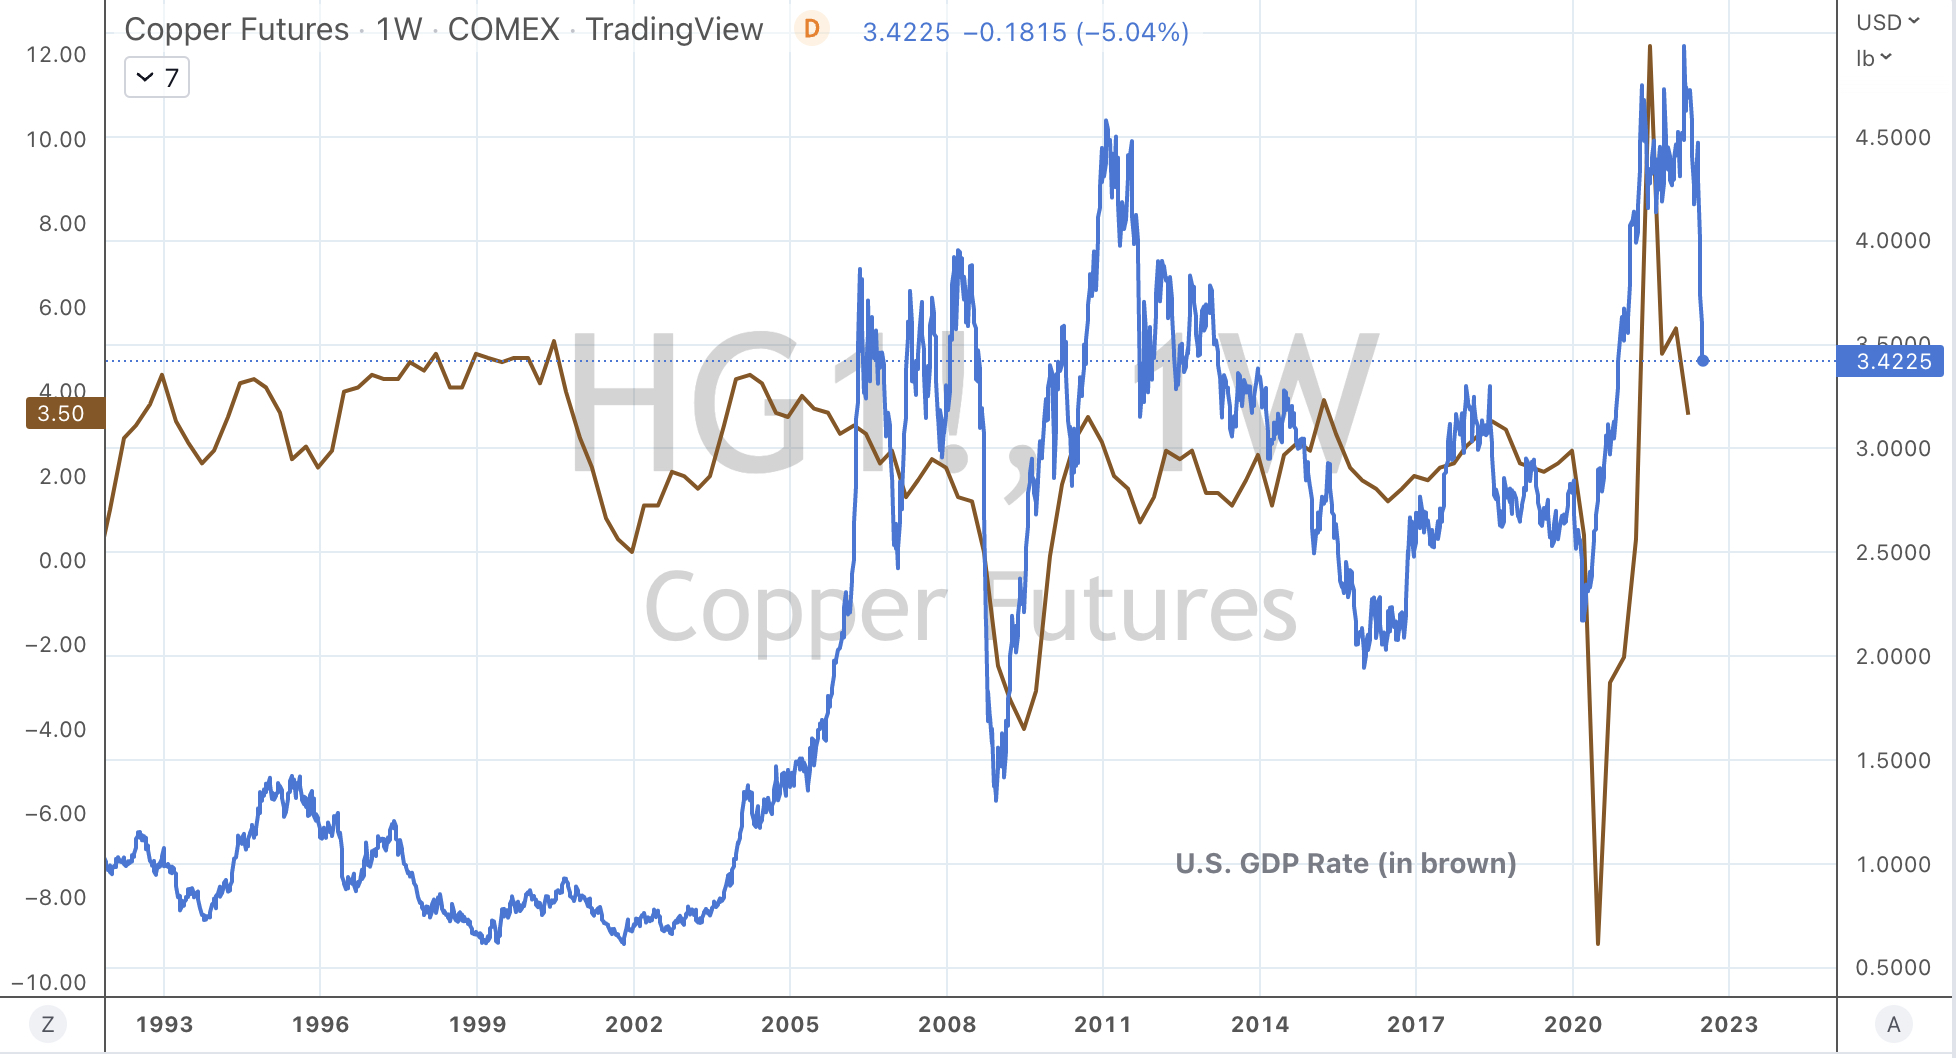
Some previous posts (published on July 3, 2022) have featured comments about Copper and its correlation to GDP and Interest Rates. Today, Copper has seen its lowest price since February 5, 2021, a 17 month low.
Some currencies saw larger than normal moves, namely in the AUD/JPY and the AUD/USD, where they shifted 1.8%. The South African Rand dropped 3.4% and the Chilean Peso (vs USD) also weakened. Notice the commodity centric currencies all have softened in unison with lower commodity prices.
Corn is back to late January 2022 prices, which is a month (and lower) prior to the Ukrainian invasion.
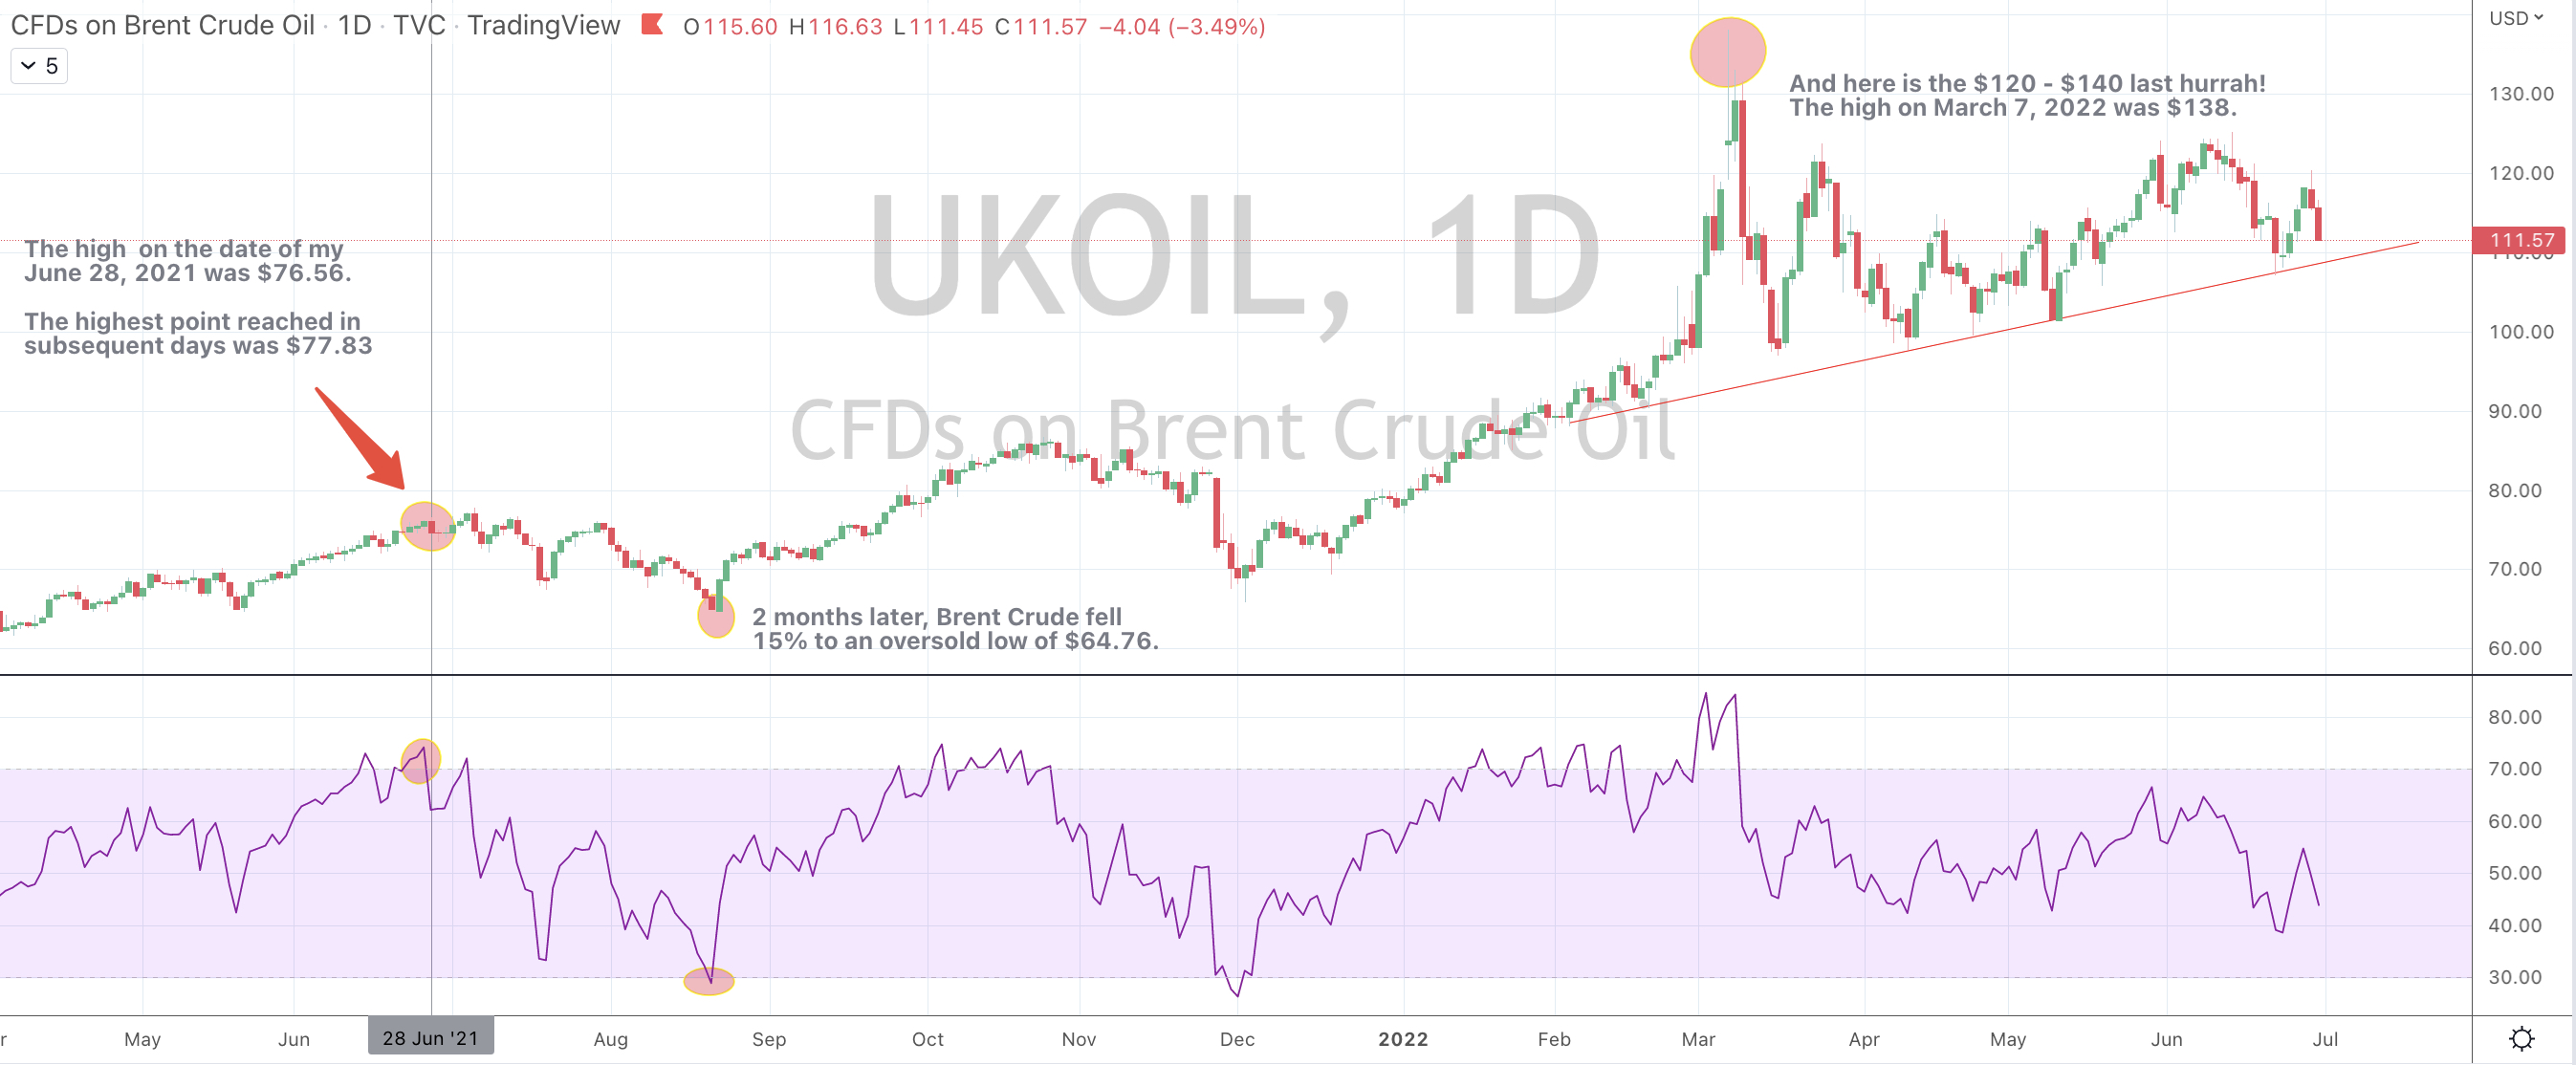
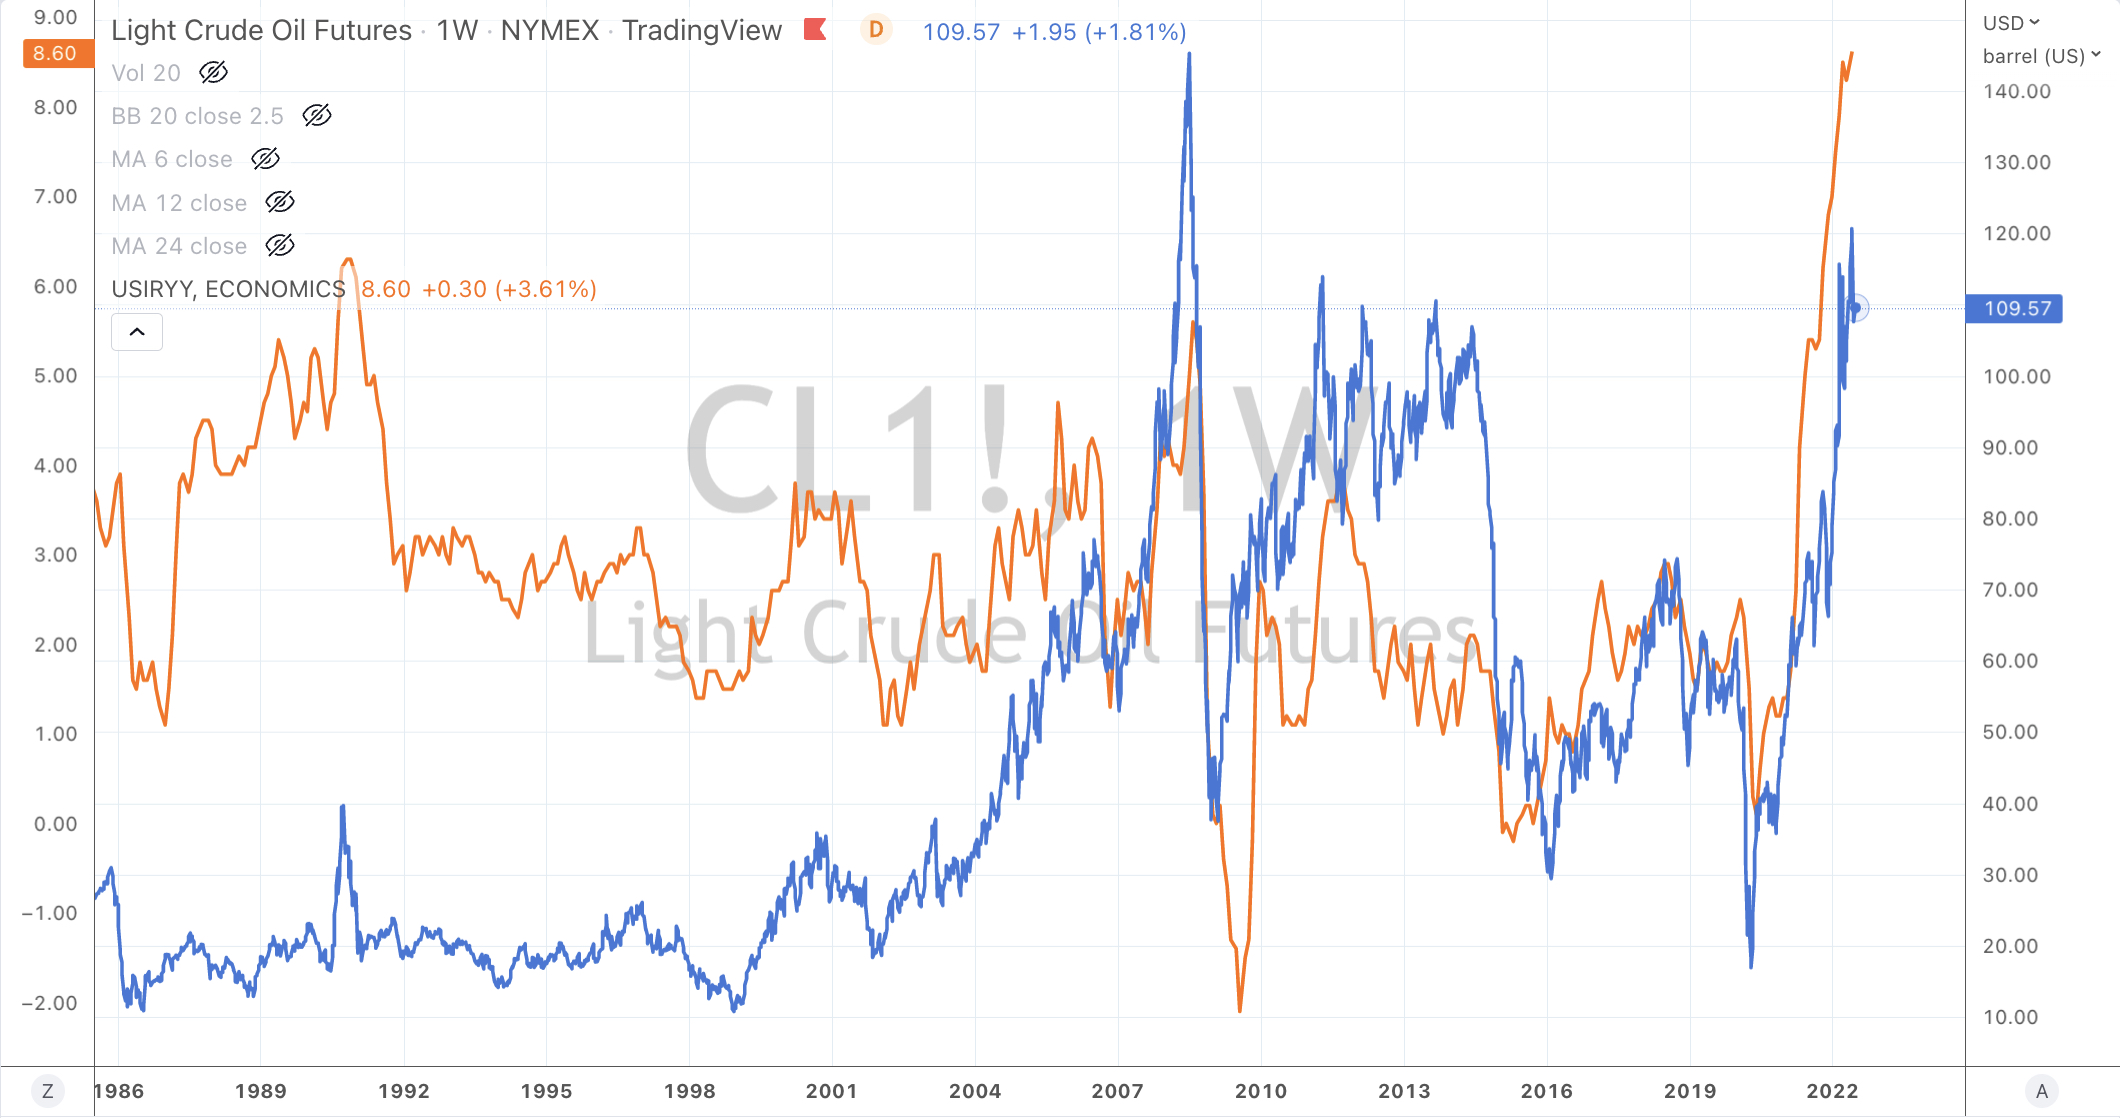
I’m pondering that Brent Crude has risk from its current $111 down to $70 and so I wonder what would this say about the inflation readings we may see in Q2 of 2023. Remembering that inflation figures are a lagging indicator.
Natural Gas continues to fall. It fell 8% for the week, even following a 5.6% rebound rise on Friday. Before the Friday bounce I wrote a seperate note about closing the ‘short trade’ and taking the ‘fat part of the trade’. This cheaper price will now benefit certain company’s inputs. The same cheaper input question applies to those companies in the business of buying Cotton.
While, ‘the other gas’, LNG has soared 52% in 2 weeks. I didn’t see that ‘trading surge’ coming.
Tin is in the Overbought column falling another 6%, which is now sank 30% in the past 3 weeks.
Gold (in AUD) is trading up against some important resistance.
I see a possible 70% long-term decline in the price of Coffee.
And I may write more about the Oversold, contrarian risk indictors that Bitcoin and Ethereum have become.
The larger advancers over the past week comprised of;
China Coal 6.1%, JKM 4.3%, Lumber 15.3%, LNG 6.4%, Orange Juice 4.8%, Palladium 4.5%, Dutch TTF 15%, Urea (U.S. Gulf) 6.6%, Uranium 2.3% and China’s CSI 300 1.6%.
The group of decliners included;
Australian Coal (22.8%), Aluminium (1.1%), Bloomberg Commodity Index (3.5%), Baltic Dry Index (5%), Cocoa (4.9%), Gasoil (5.8%), Gold (0.9%), Copper (3.7%), Heating Oil (9.7%), Hot Rolled Coil Steel (17.5%), Tin (6.4%), Natural Gas (7.9%), Nickel (2.7%), Platinum (3.6%), Gasoline (5.1%), Silver (6.9%), CRB Index (2.3%), Cotton (1.7%), Urea – Middle East (1.9%), Silver in AUD (4.3%), Corn (17.4%), Oats (5.3%), Wheat (9.7%), Soybean (2%), Bitcoin (8.8%), Ethereum (12.8%), GBTC (11.6%), KBW Banking Index (2.4%), CAC (2.3%), DAX (2.3%), Dow Jones Industrials (1.3%), DJ Transports (1.9%), MIB (3.5%), Kospi (2.6%), S&P Midcap 400 (1.6%), Nasdaq 100 (4.3%), Nikkei (2.1%), Russell 2000 (2.2%), SOX Index (9.6%), S&P 500 2.2%, TAIEX (6.3%) and the Nasdaq Composite slumped 4.1%.
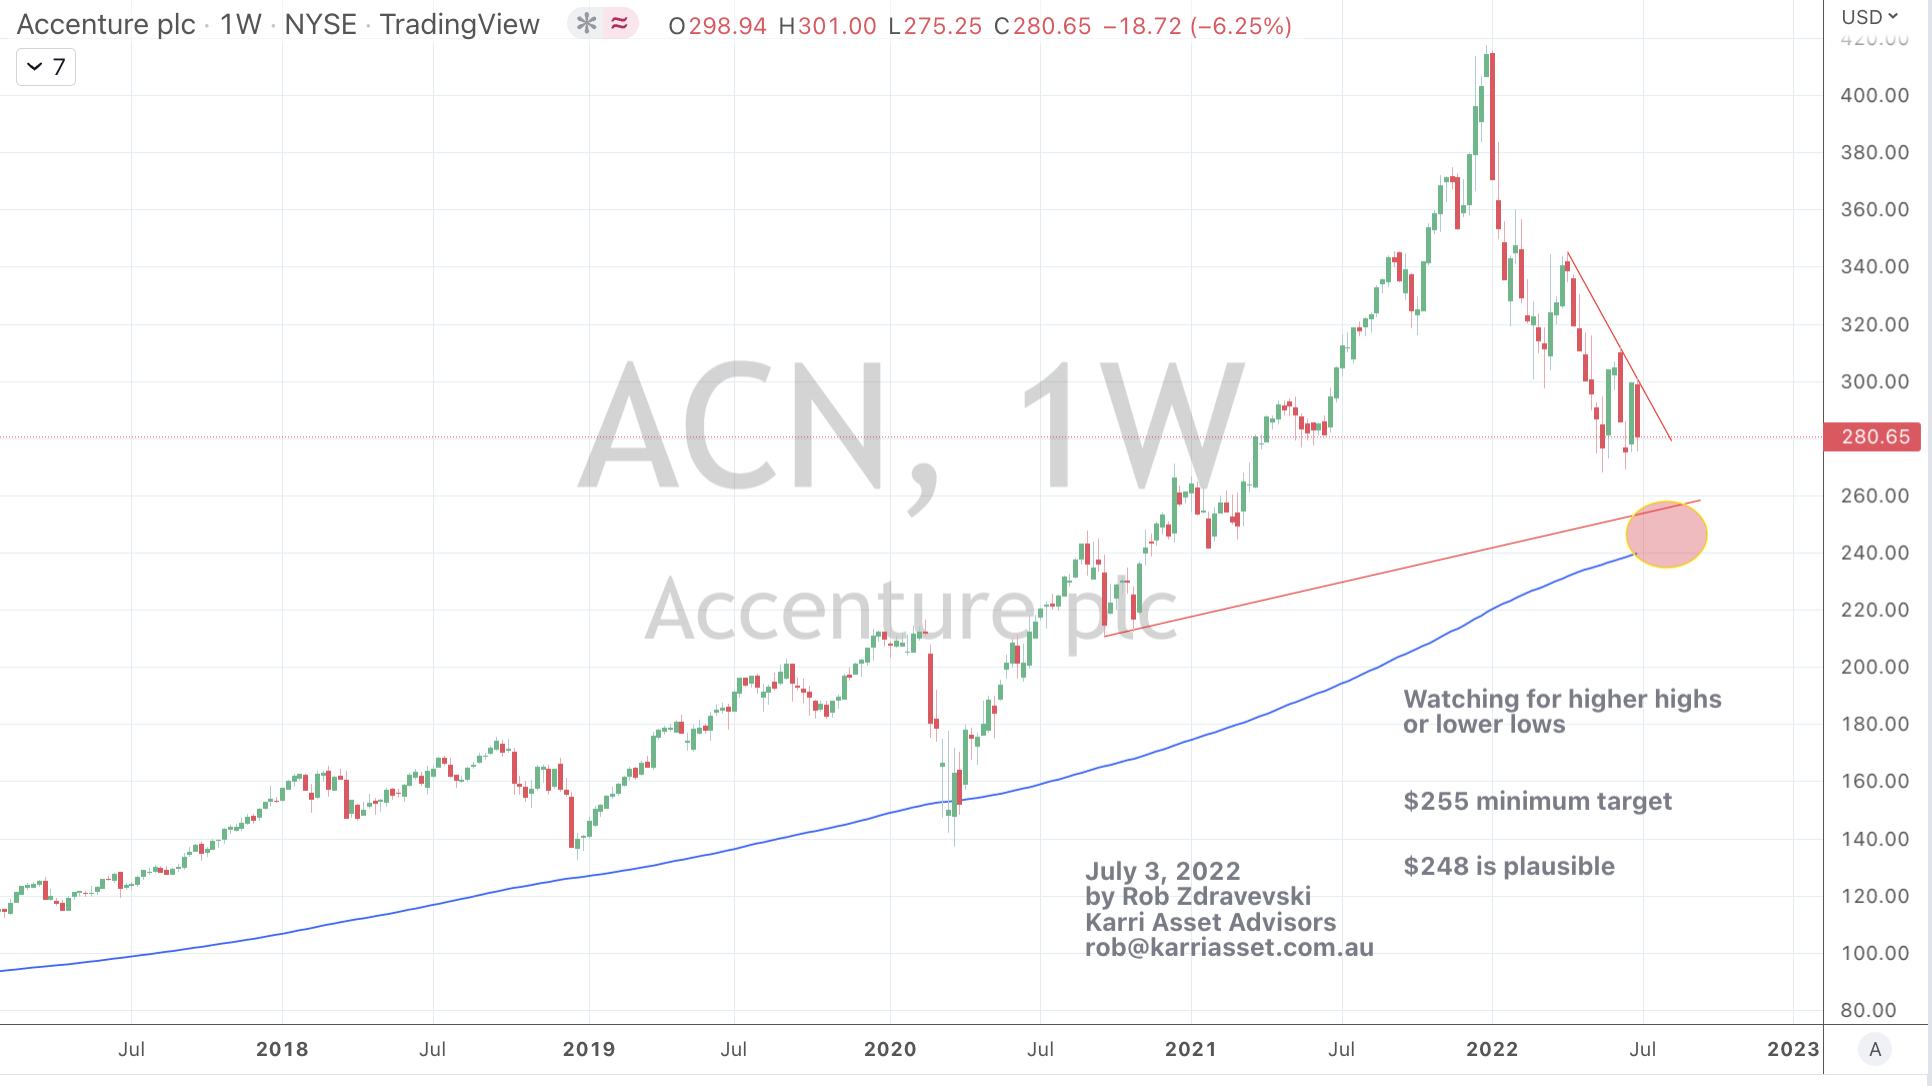
July 3, 2022
by Rob Zdravevski
rob@karriasset.com.au