Different types of steepness

In one chart below, you’ll see the amazing 10 fold rise and steepness of the U.S. 2 year bond yield. It’s obvious that the market has factored many Fed rate rises.

I think it is factoring in too many and perhaps the market is concurring with the predictions of 6, 7 or 8 rate hikes.

The other chart shows the yield curve inverting for a whole 2 days. That’s hardly long enough to signal a recession, but since then it has steepened to 0.35%.

It has occurred because the front end of curve (2 years) has declined from 2.59% to 2.35% faster (‘greater’) than the 10 year yield.

This bullish steepener is good for equities.

I’m looking for the spread to initially visit 0.40%

It tells us that inflation may be peaking, which is my belief.

And it tells us that the market is considering that the Fed may not aggressively in raise rates as the market participants have previously hinted.

My position is that the Fed may hike 2 or 3 times and then cut once for they may have gone too far.

April 14, 2022

by Rob Zdravevski

rob@karriasset.com.au

little news in Rig Count land

Nothing notable to report in the overall drilling rig count numbers, but specifically the Canadians reduced the amount of rigs in operation by 16%.

Let’s see what the April 2022 report looks like, when crude prices were higher. We’ll check if there was any conviction in starting up any new activity.

April 12, 2022

by Rob Zdravevski

rob@karriasset.com.au

Does WTI Crude make a ‘lower low’

I’m watching this week if WTI Crude Oil (front month) breaks below or holds $93.53.

The Brent equivalent is $96.97

April 11, 2022

Macro Extremes (week ending April 8, 2022)

The following assets (on a weekly timeframe) registered an Overbought reading or traded more than 2.5 standard deviations above its rolling mean.


Extremes “above” the Mean (at least 2.5 standard deviations)

U.S. 10 year minus German 10 year bond yield spread

Natural Gas

Orange Juice

AUDUSD

CADUSD

AUDSGD

TBT

Overbought (RSI > 70)

Australian 2, 3,5 & 10 year government bond yields

Greek, Spanish, French, Italian, Portuguese, New Zealand, Swiss, French, Canadian & Korean 10 year government bond yields

German 5 and 10 year yields

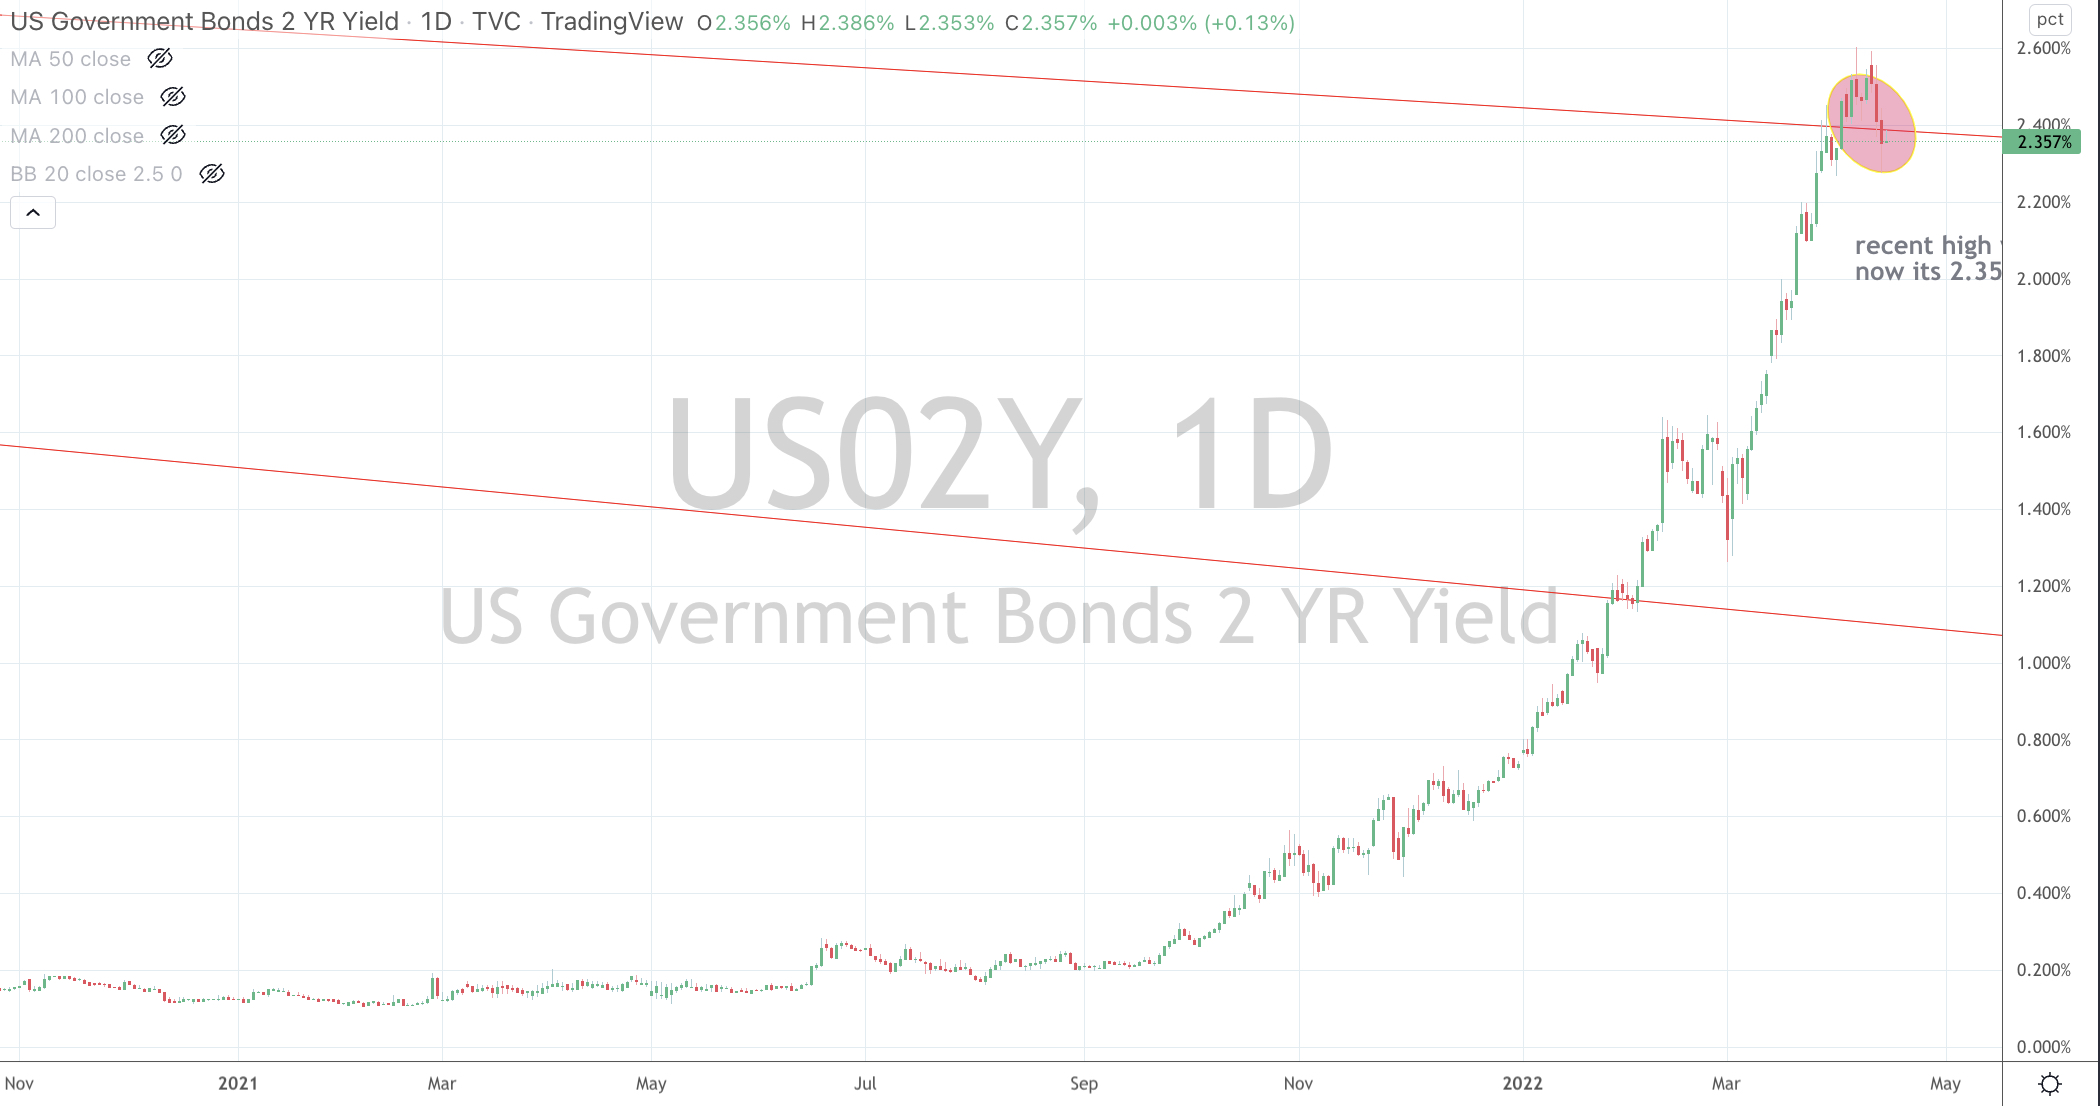
U.S. 2, 5 & 10 year yields

Bloomberg Commodity & CRB Index

Uranium 

Corn


The Overbought Quinella – Both Overbought and Traded at > 2.5 standard deviations above the weekly mean)

Swedish 10’s

TBX

AUDGBP

AUDJPY

Assets (securities) which touched the other side of the extreme, being Oversold (where the RSI is < 30) or were at least 2.5 standard deviations below its mean are;


Extremes “below” the Mean (at least 2.5 standard deviations)

Gold Volatility Index

Bond ETF’s TLT & IEF


Oversold (RSI < 30)

HKD/USD

Russia’s MOEX Index

The Oversold Quinella – Both Overbought and Traded at > 2.5 standard deviations above the weekly mean)
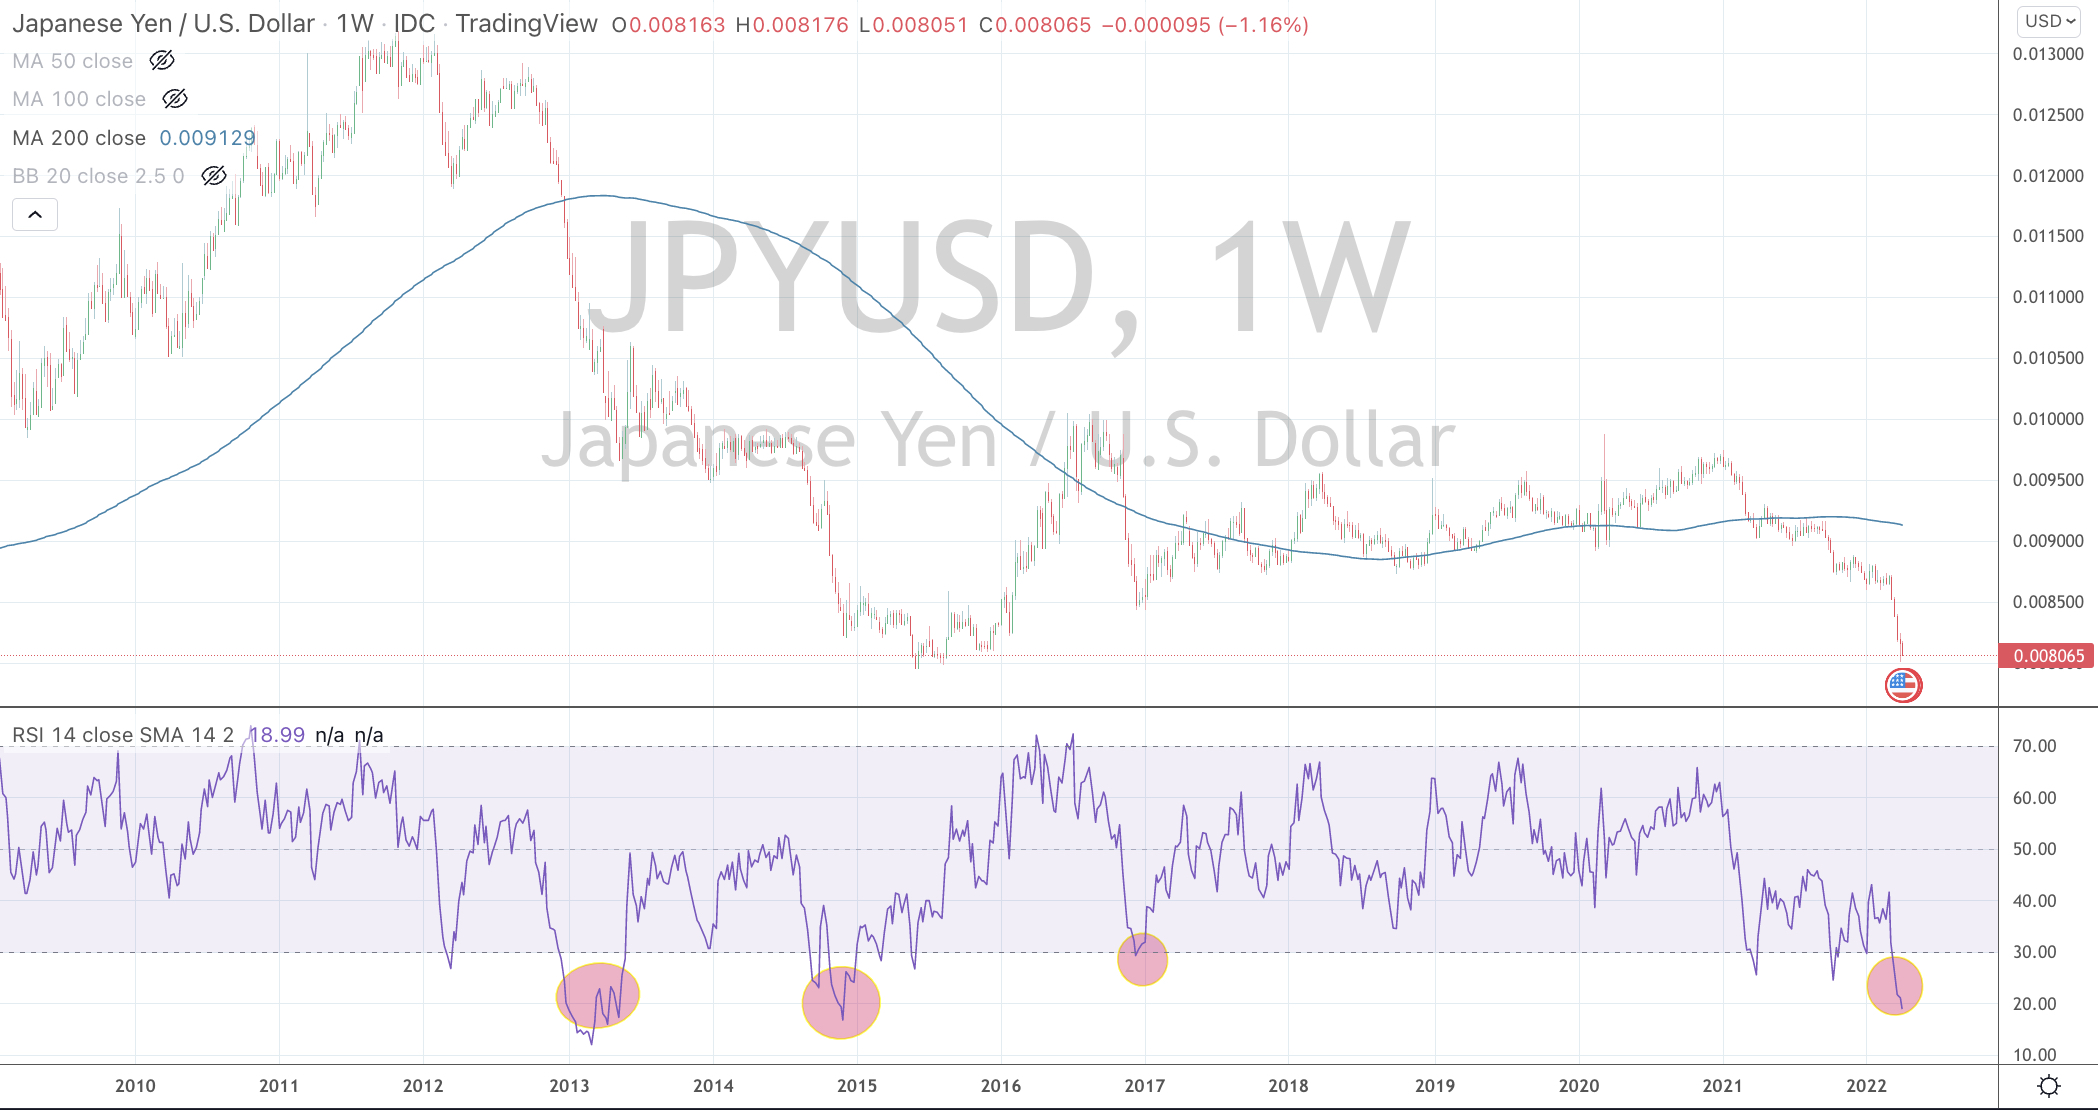
JPY/USD

U.S. 10 year minus 5 year government bond yield spread (which has now inverting and at lowest since September 2000.


Notes & Ideas:

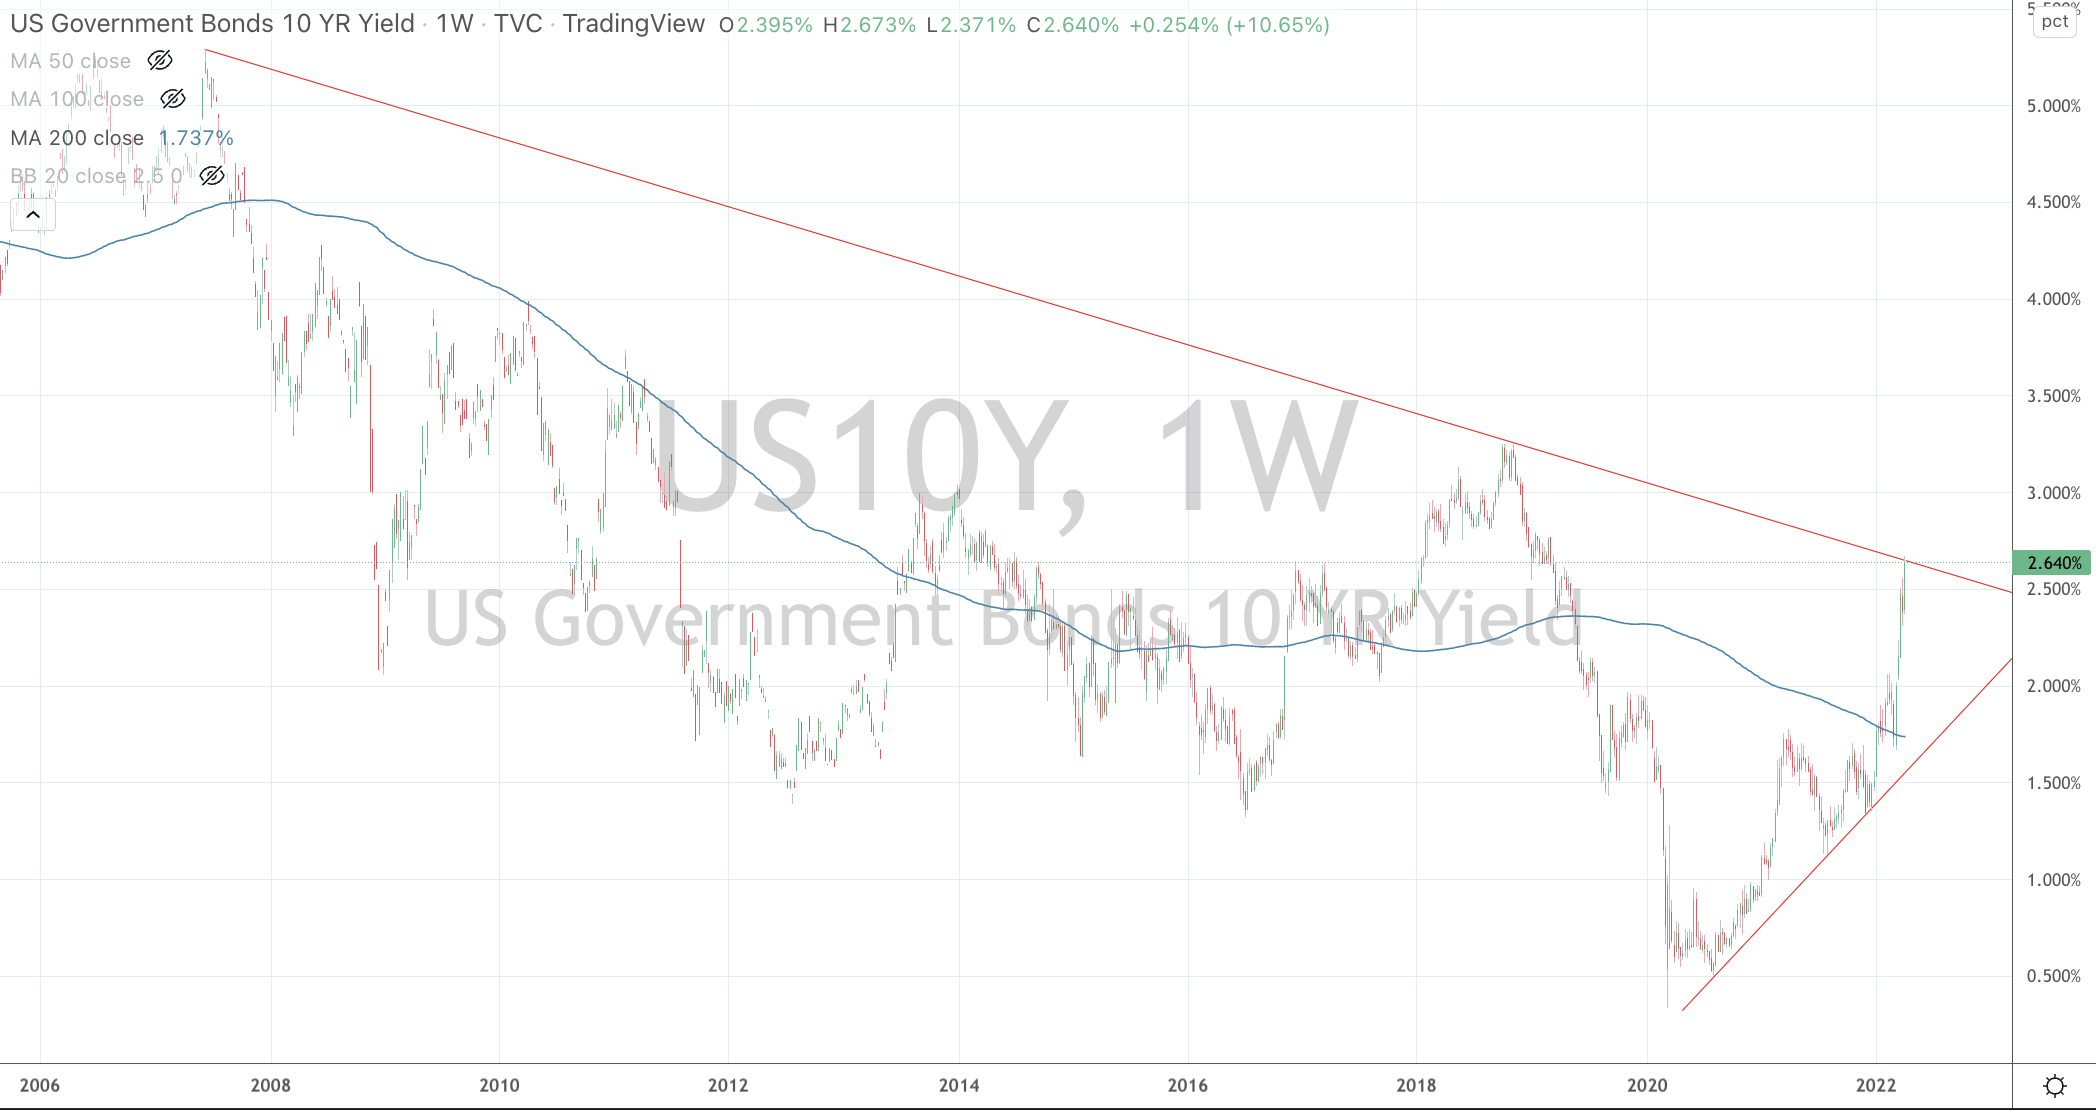
The big news for the week was in the bond market (as 10 year yields touch and tickle overbought extremes.

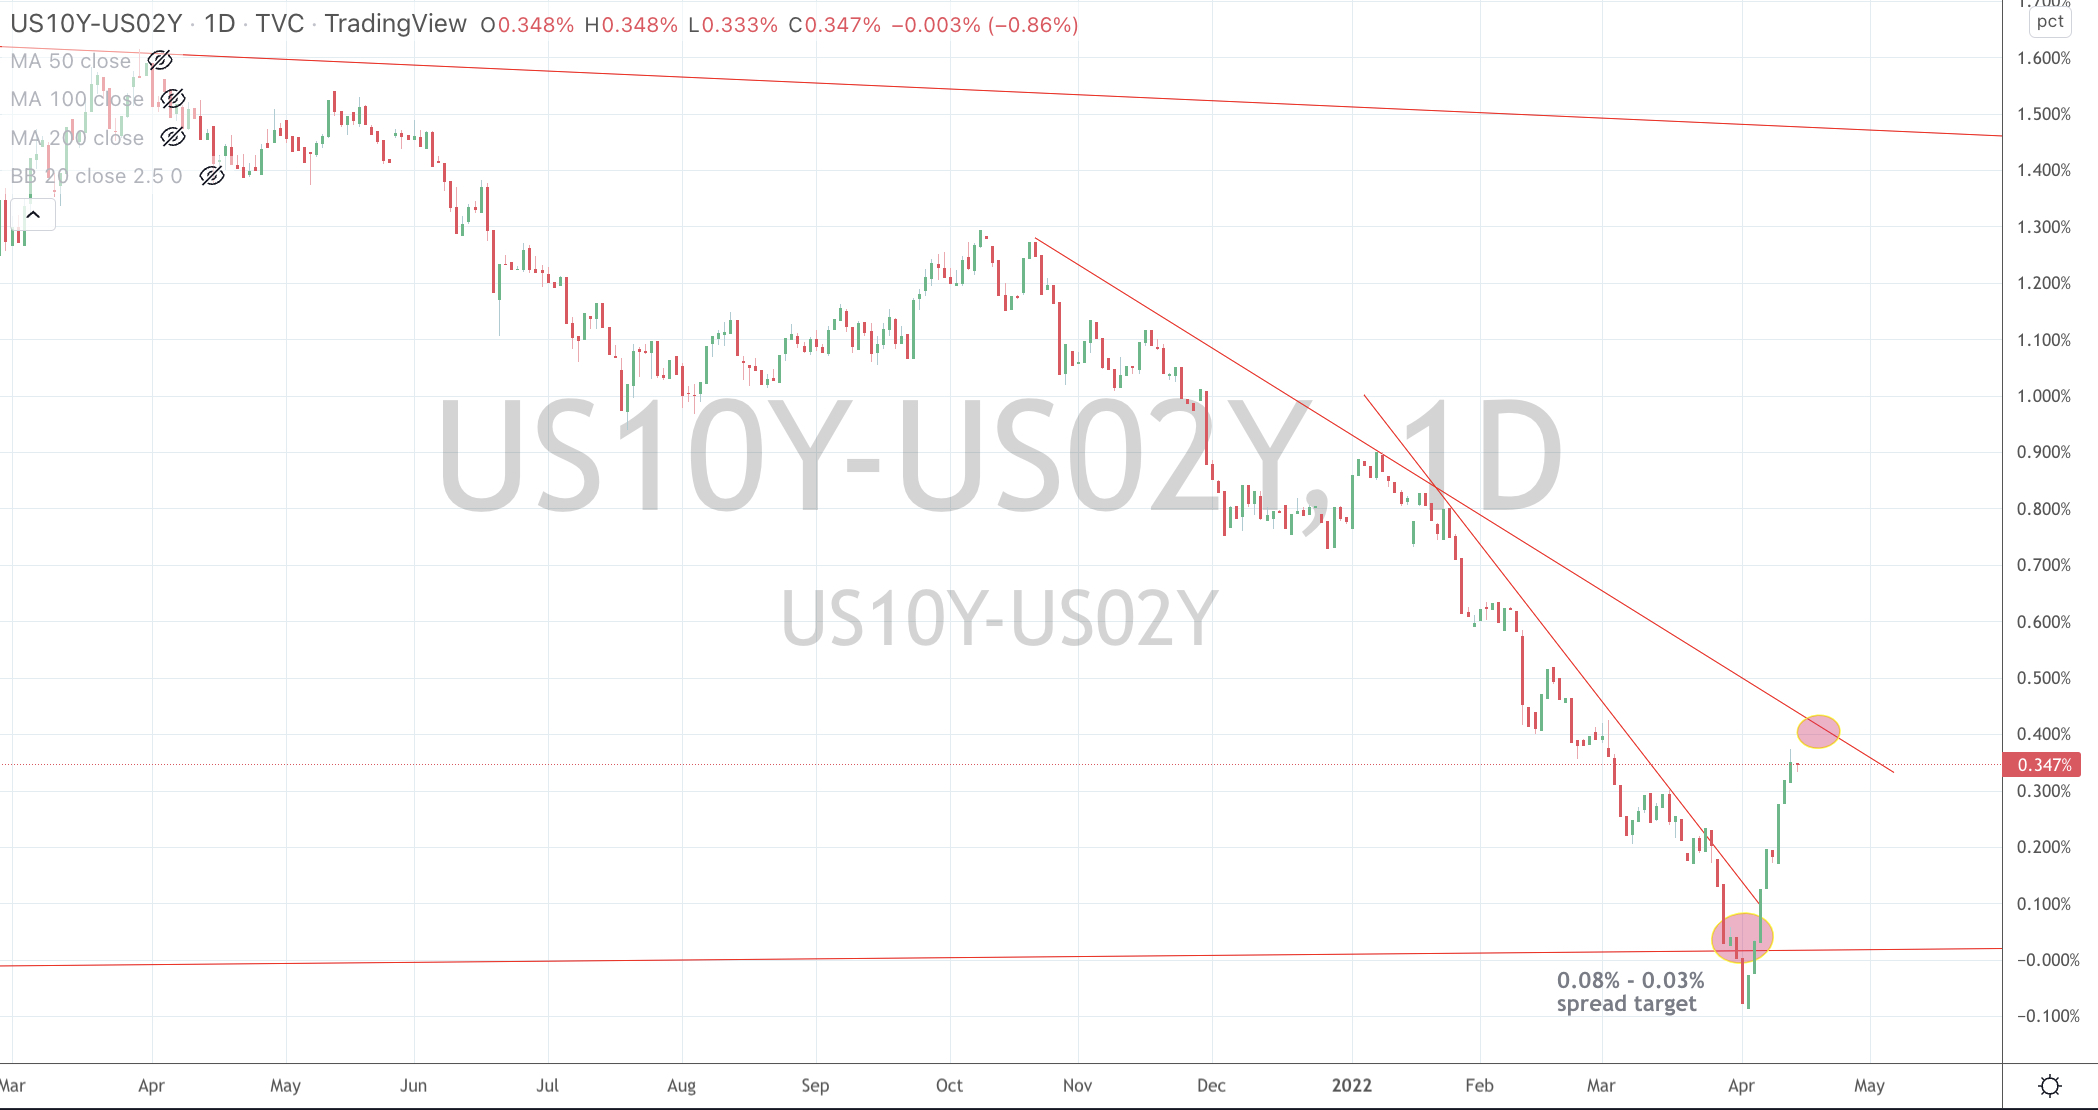
The U.S. yield curve inverted for a couple days and now it isn’t. Much noise (once again) for not much substance. Curves needs to invert more than a few days before probability stacks up for a future recession call.

In fact, we saw a bullish outside reversal week for the US10-02 spread and the US10-05 spread, along with the Swiss 10’s and Rotterdam delivered coal price.

The other big news is in the currency market, especially the divergence being seen in the currencies of the commodity sensitive economies of Australia and Canada.

The AUD and CAD are hitting highs against many currencies whilst the USD is also marking its own highs. These two moments seldom occur at the same time.

We’re also seeing multi-year weakness in the Yen and the Euro is getting a drubbing.

It was a mild week amongst the major global equity indices as the ASX 200 only fell 0.2% and the S&P 500 declined 1.3%, while some sub U.S. indices did see outlier weakness such as the SOX, the Russell 2000 and MidCap 400.

In expected news, the AUDEUR, the DXY and Oslo bourse are nearing overbought extremes. 

Meanwhile, Bitcoin and Ethereum fell 8% for the week, meanwhile Cardano remains 67% below its September 2021 high.

Speaking of 67%, Istanbul’s BIST 100 has risen 67% since September 2021.

The larger advancers over the past week comprised of; 

Rotterda, Coal 11.2%, Bloomberg Commodity Index 2%, Cocoa 2.9%, Natural Gas 9.8%, Orange Juice 6.4%, Palladium 6.7%, Sugar 5.4%, CRB Index 1.7%, Urea 2.5%, Uranium 9%, Corn 4.6%, Oats 7.4%, Soybean 6.7%, Wheat 6.8%, Swiss SMI 2.7%, FTSE 100 rose 1.8%, Istanbul surged 5.3% (up 20% in past 5 weeks) and Australia’s ASX 200 advanced 1.2%.

The group of decliners included;

Aluminium (3.6%), Australian Coal (12.6%, now down 37% in past 3 weeks), Baltic Dry Index (12.8%), China Coal (2.7%), Gasoil (6.9%), Gold Volatility Index (3.7%), Lean Hogs (2.3%), Heating Oil (3.1%), Hot Rolled Coil Steel (3.3%), JKM (3.1%), LNH (12.6%), Rubber (3.1%), Dutch TTF Gas (7.4%), Brent Crude (2%), KBW Banking Index (2.3%), CAC (2%), Dow Jones Transports (6.7%), Bovespa (2.7%), MOEX (6.1%), Nasdaq 100 fell 3.6%, Nikkei 225 (2.5%), TAIEX (1.9%), Russell 2000 (4.6%), Philadelphia Semiconductor Index “SOX” (7.3%), S&P Midcap 400 3.4%0 and S&P 500 declined 1.3%.

April 10, 2022

by Rob Zdravevski

rob@karriasset.com.au  

Identifying The Bigger Calls – Buy Yen

The Japanese Yen is at its weakest in 6 years against the Aussie and the U.S. Dollar.

In the chart below, I’ve circled 4 moments since 2009 when it was decidedly Oversold, trading at extended percentages below its 200 week moving average and at 2.5 standard deviations below its rolling weekly mean.

Buying some Yen is the first step,

nibbling away at some cheap Japanese equities is the next.

April 8, 2022

by Rob Zdravevski

rob@karriasset.com.au

Just following the sheep

Would you like to see what a herd of sheep looks like?

It’s when you pay 20%-30% more for a stock, the day after when a ‘celebrity’ investor has taken a substantial holding.

Isn’t astonishing that those buyers didn’t perceive Twitter or HP to be worthy of their investment dollars only a day earlier?

It’s code for nobody did their research.

All you can do is wish them well.

We can never tell how long the new buyers will hold their stock for, but I’ll check back on this in 6 months or so.

April 8, 2022

by Rob Zdravevski

rob@karriasset.com.au

Temporary abating rates brings…

Sure, I think we see higher interest rates. My view is that U.S. 10 year bonds yield 3% – 3.2% into 2023.

For now, yields are a bit full and I look for the 10’s to come back to the 1.9% range into September – October 2022 timeframe.

Should that occur, I’d expect inflation readings to abate and GDP to decline.

With that comes a bunch correlated reactions such as the oil price declines, cyclicals come off the boil, rising stock inventories due to higher ‘produced’ prices not being paid for or accepted, while boding well for deflation producing technology companies.

April 8, 2022

by Rob Zdravevski

rob@karriasset.com.au

Friday Watch

Copper and Oil haven’t quite made a new, recent lower low than seen 7-20 days ago and watching if AUDUSD trades below 0.7456 on Friday. If it does, it’ll be a bearish outside reversal week.

and I’m warming towards Platinum.

April 8, 2022

by Rob Zdravevski

rob@karriasset.com.au

Doctor Copper


I’m queuing off the price of Copper at the moment, as it’s approaching a support line, whether it makes a recent ‘lower low’ and changes the direction of its trend (on a daily basis).

Here is a chart overlaying the Copper/Gold Ratio, the price of WTI Crude Oil and the U.S. 10 year bond yield.

If you throw in some currencies, the CRB Index, the S&P 500 or Gold and these pictures become quite informative.

April 7, 2022

by Rob Zdravevski

rob@karriasset.com.au

10’s target and flat yield curve match up

And the 2.66% 10’s target (seen on April 6, 2022) coincides with the 10-2 spread playing in the 0.03% – 0.08% range I have depicting in recent posts.