Following liquidity and capital flow
September 30, 2024 Leave a comment
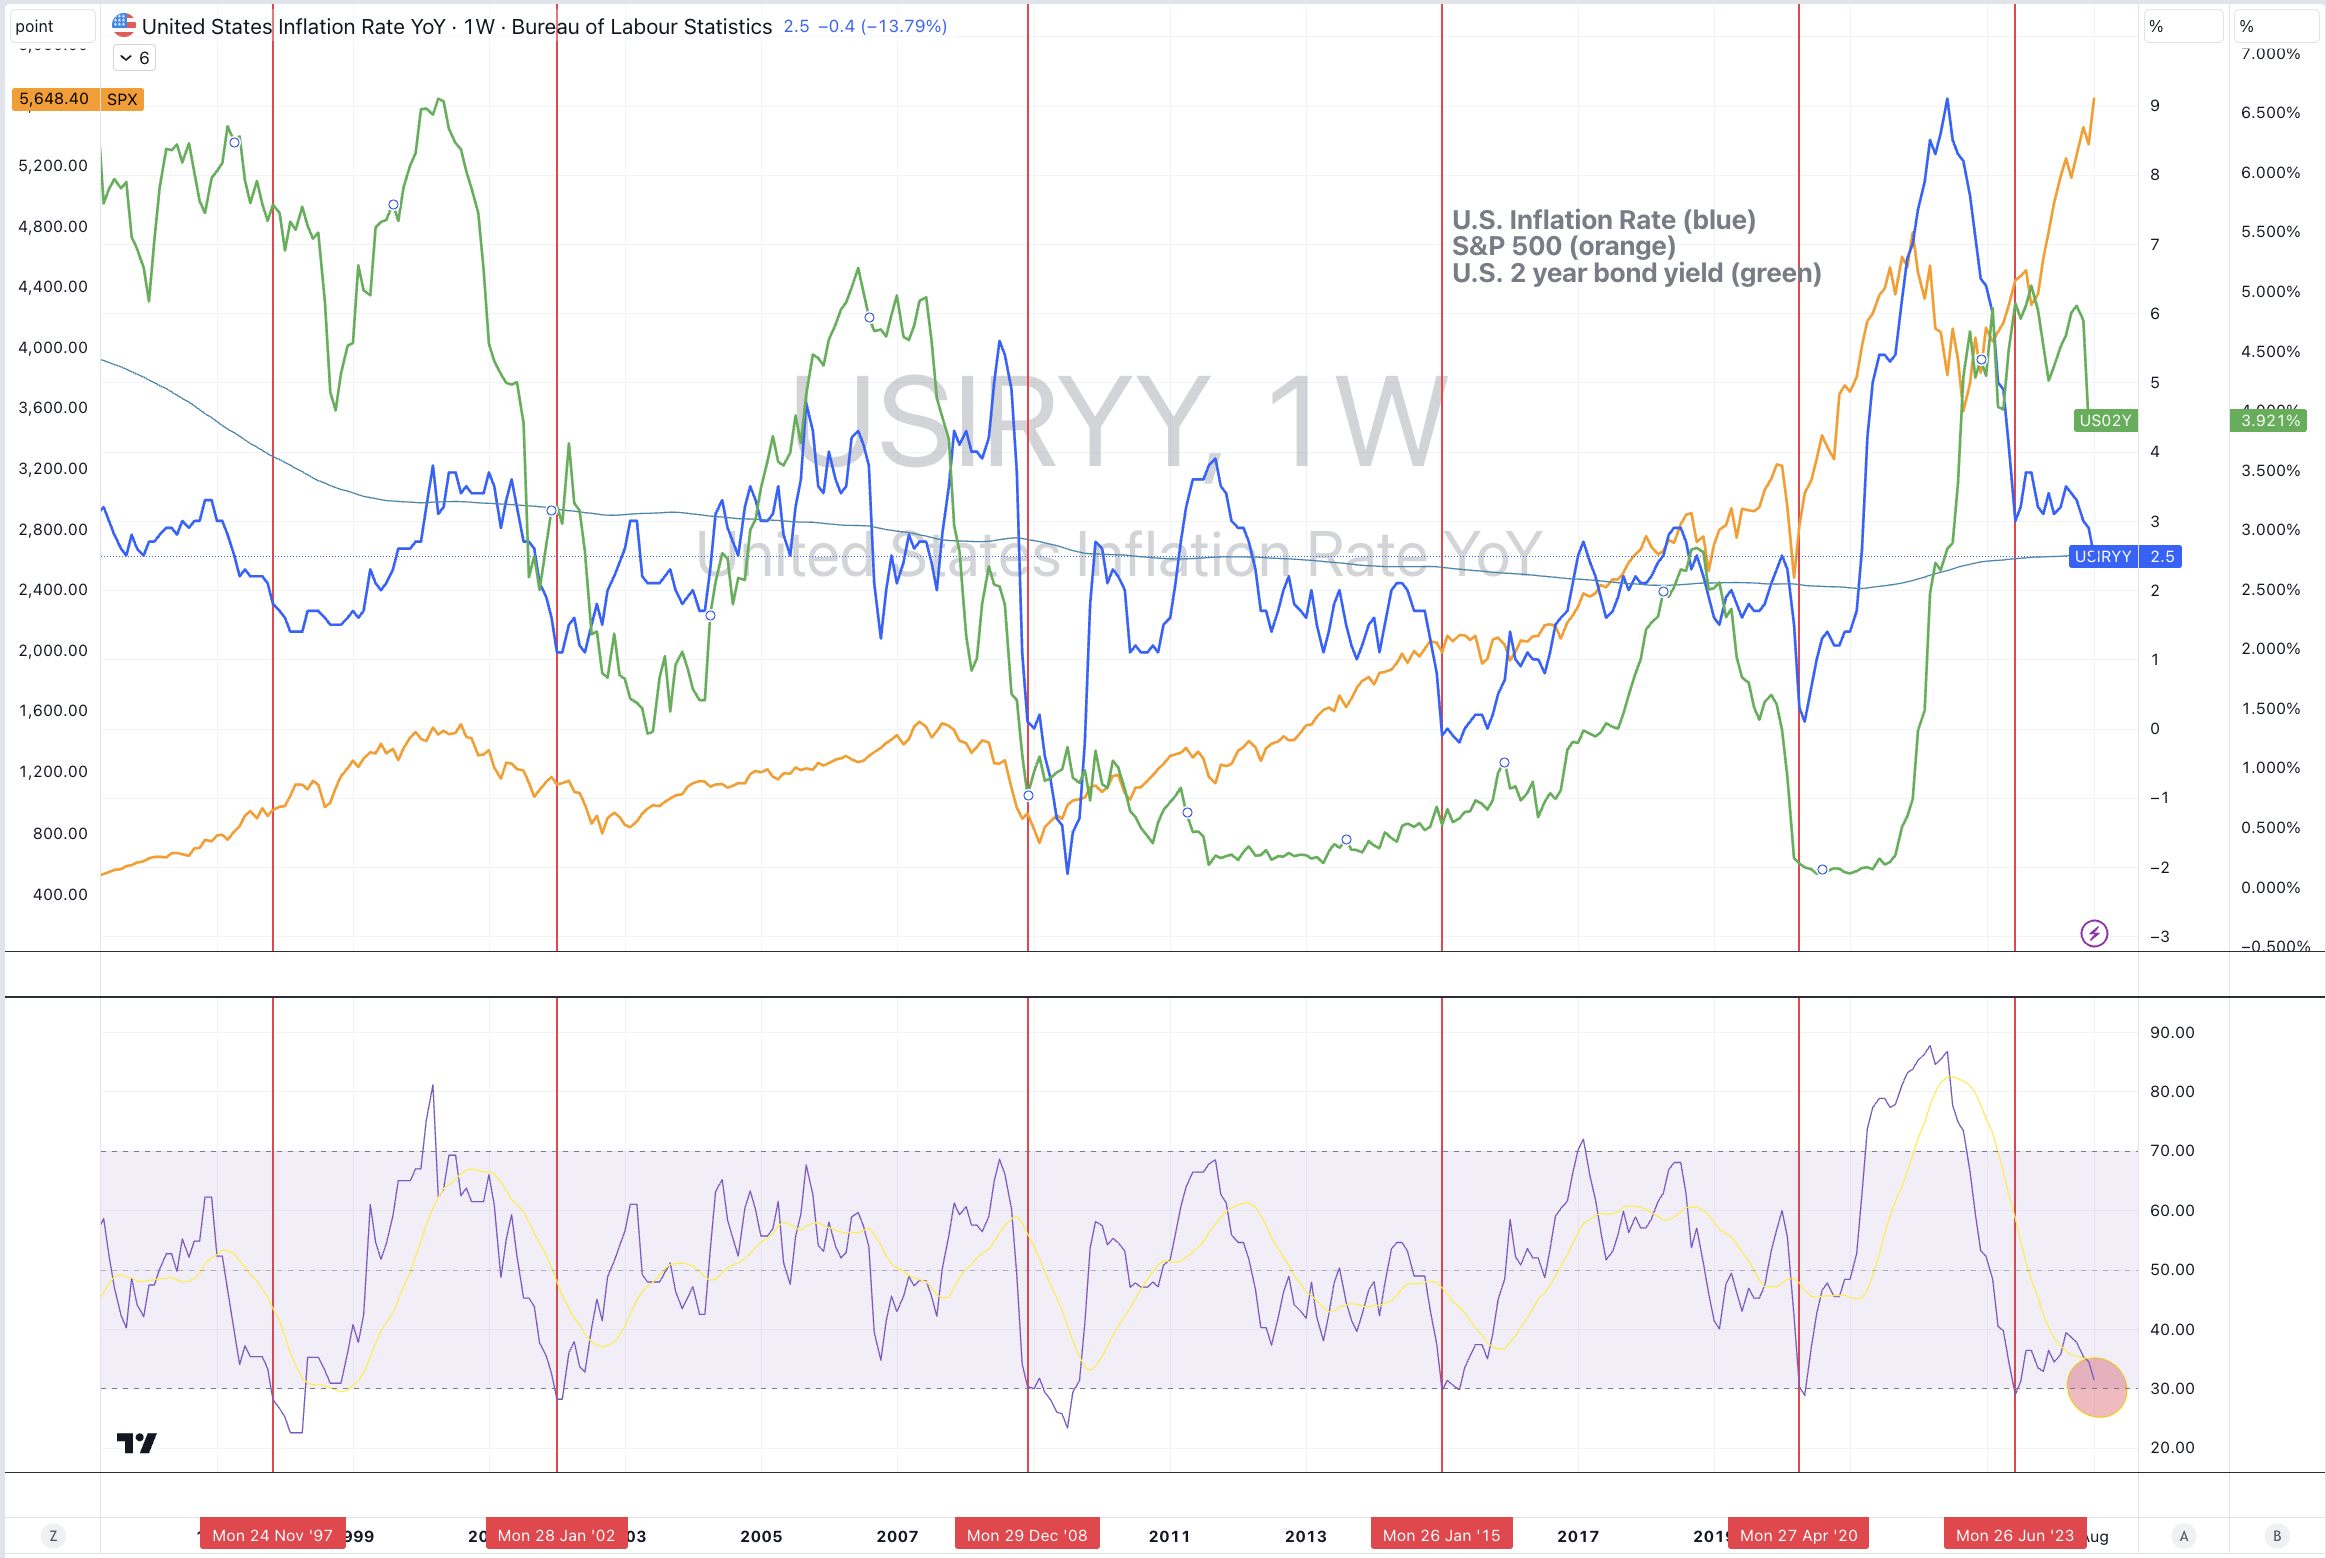
This study shows the 6 times (over the past 30 years) that the U.S. inflation rate (blue line) has been oversold. It’s nearing a 7th occurrence.
It dances with the S&P 500 (orange) and the U.S. 2 year bond (green) yield.
As inflation rises, bond yields rise because bonds are being sold. This can be paraphased as an increase in #liquidity.
When bonds are sold, money tends to finds it way into equities.
In this week’s edition of Macro Extremes, the U.S. 2’s appear in the oversold category.
September 30, 2024
by Rob Zdravevski
rob@karriasset.com.au