Negative yields spreads leave no alternative
May 18, 2024 Leave a comment
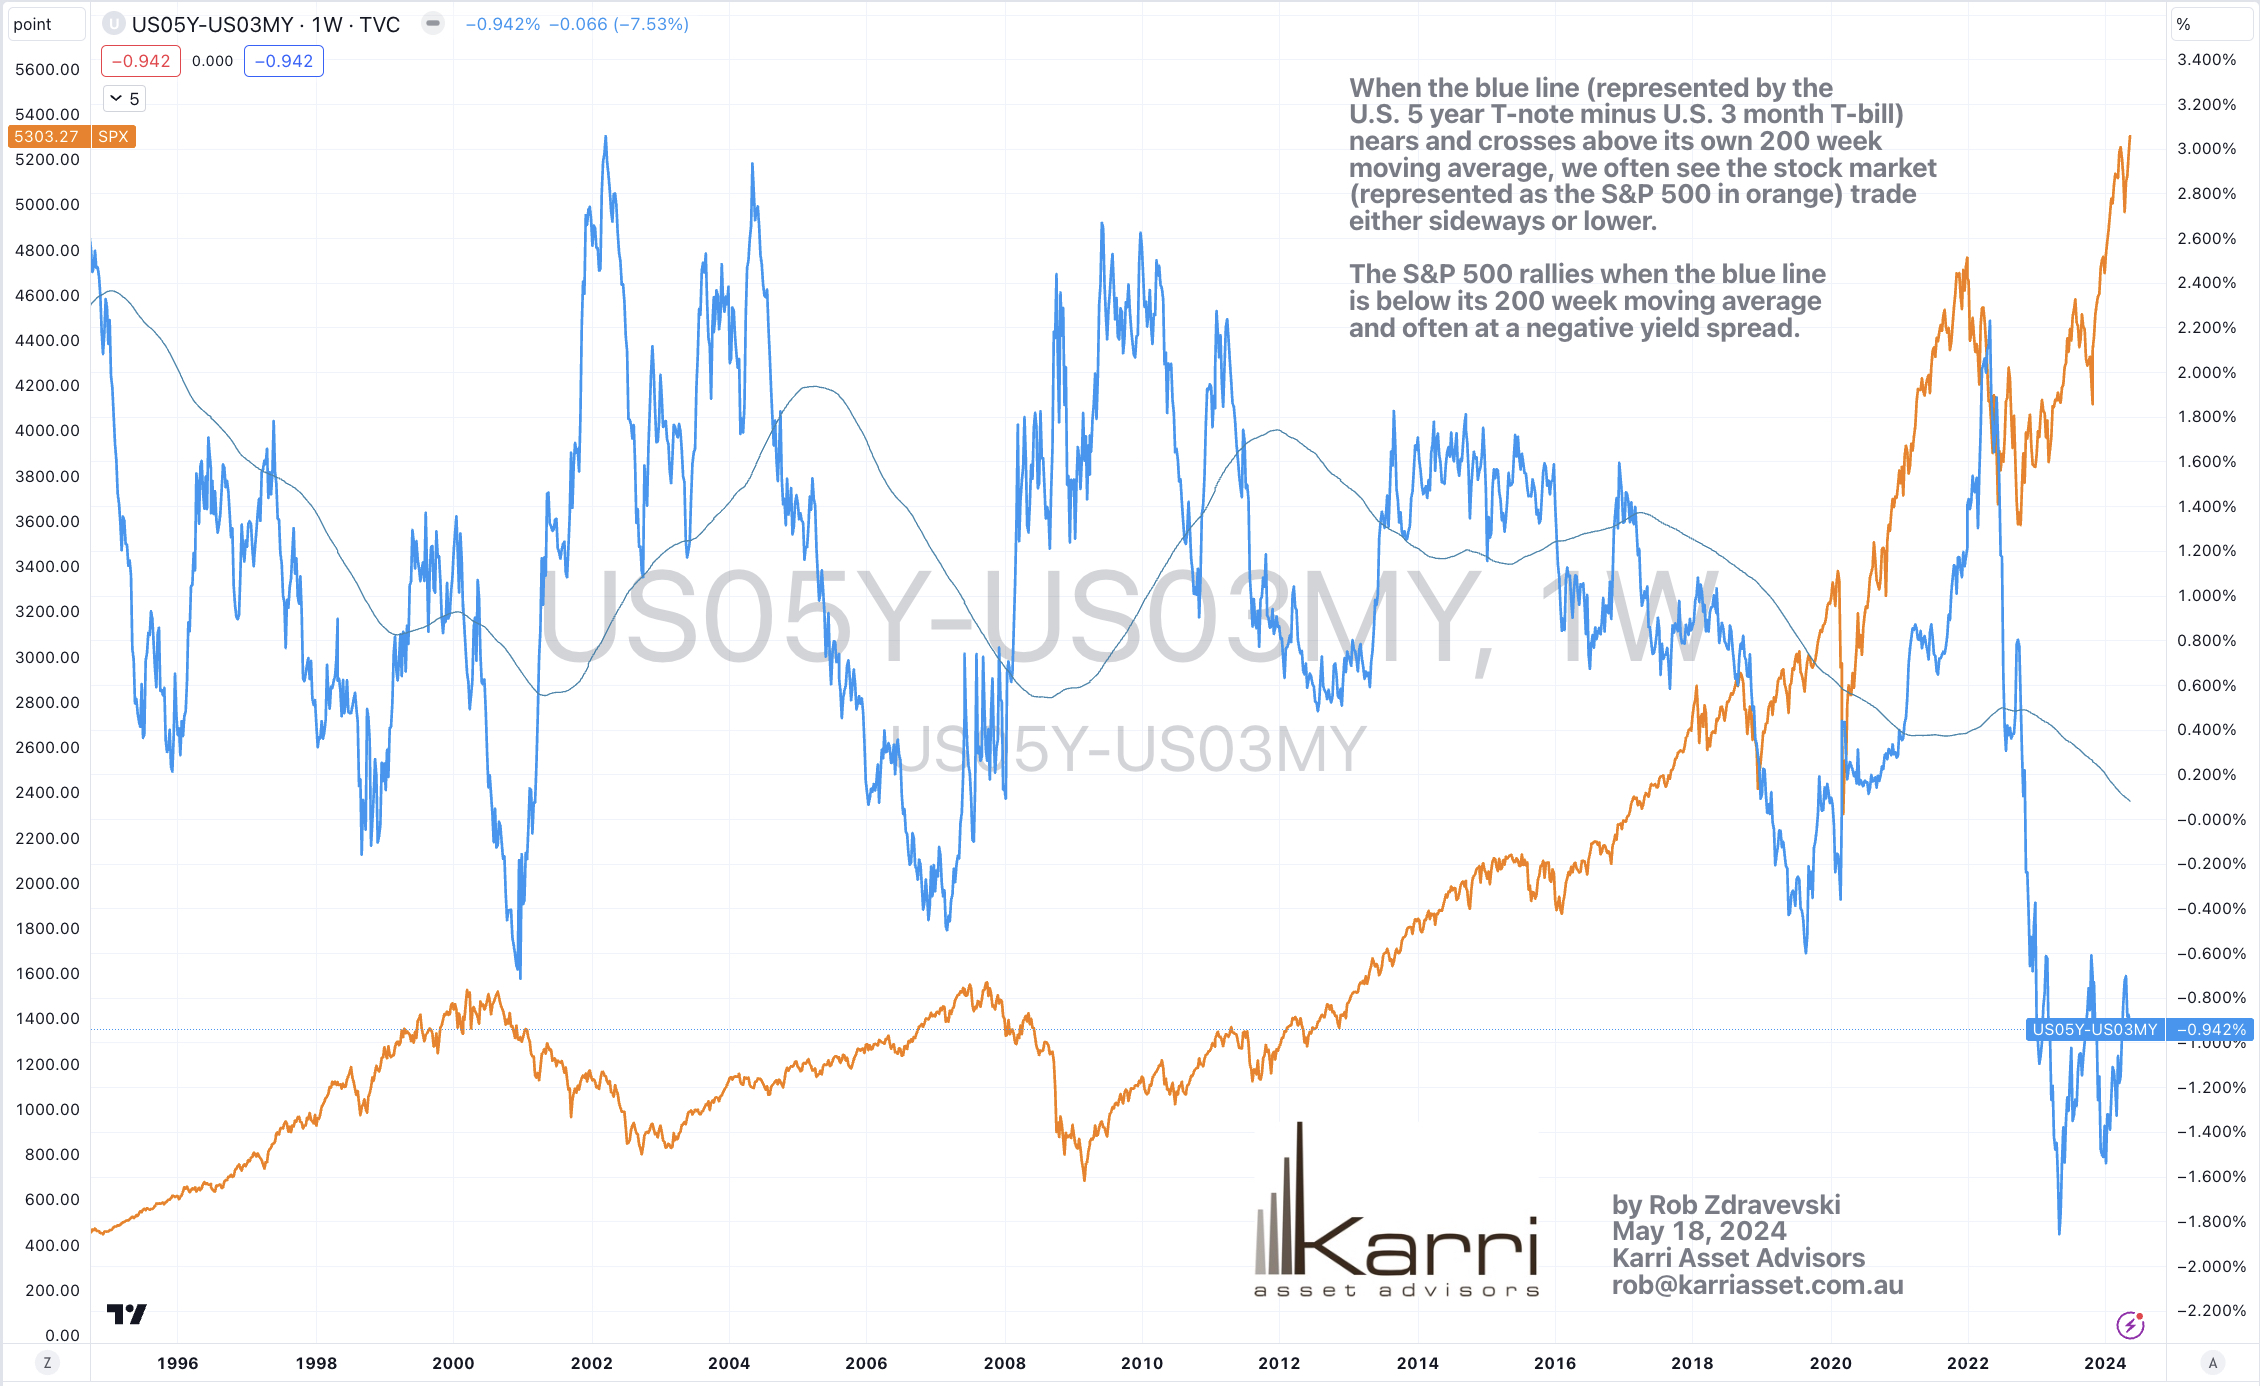
When the blue line (represented by the U.S. 5 year T-note minus U.S. 3 month T-bill) nears and crosses above its own 200 week moving average, we often see the stock market (represented as the S&P 500 in orange) trade either sideways or lower.
The S&P 500 rallies when the blue line is below its 200 week moving average and often at a negative yield spread.
May 18, 2024
by Rob Zdravevski
rob@karriasset.com.au