Why equities will rip higher
June 8, 2023 Leave a comment
Amongst a host of perverse reasons, this study is one that assists making the case why I can see equity markets could move higher.
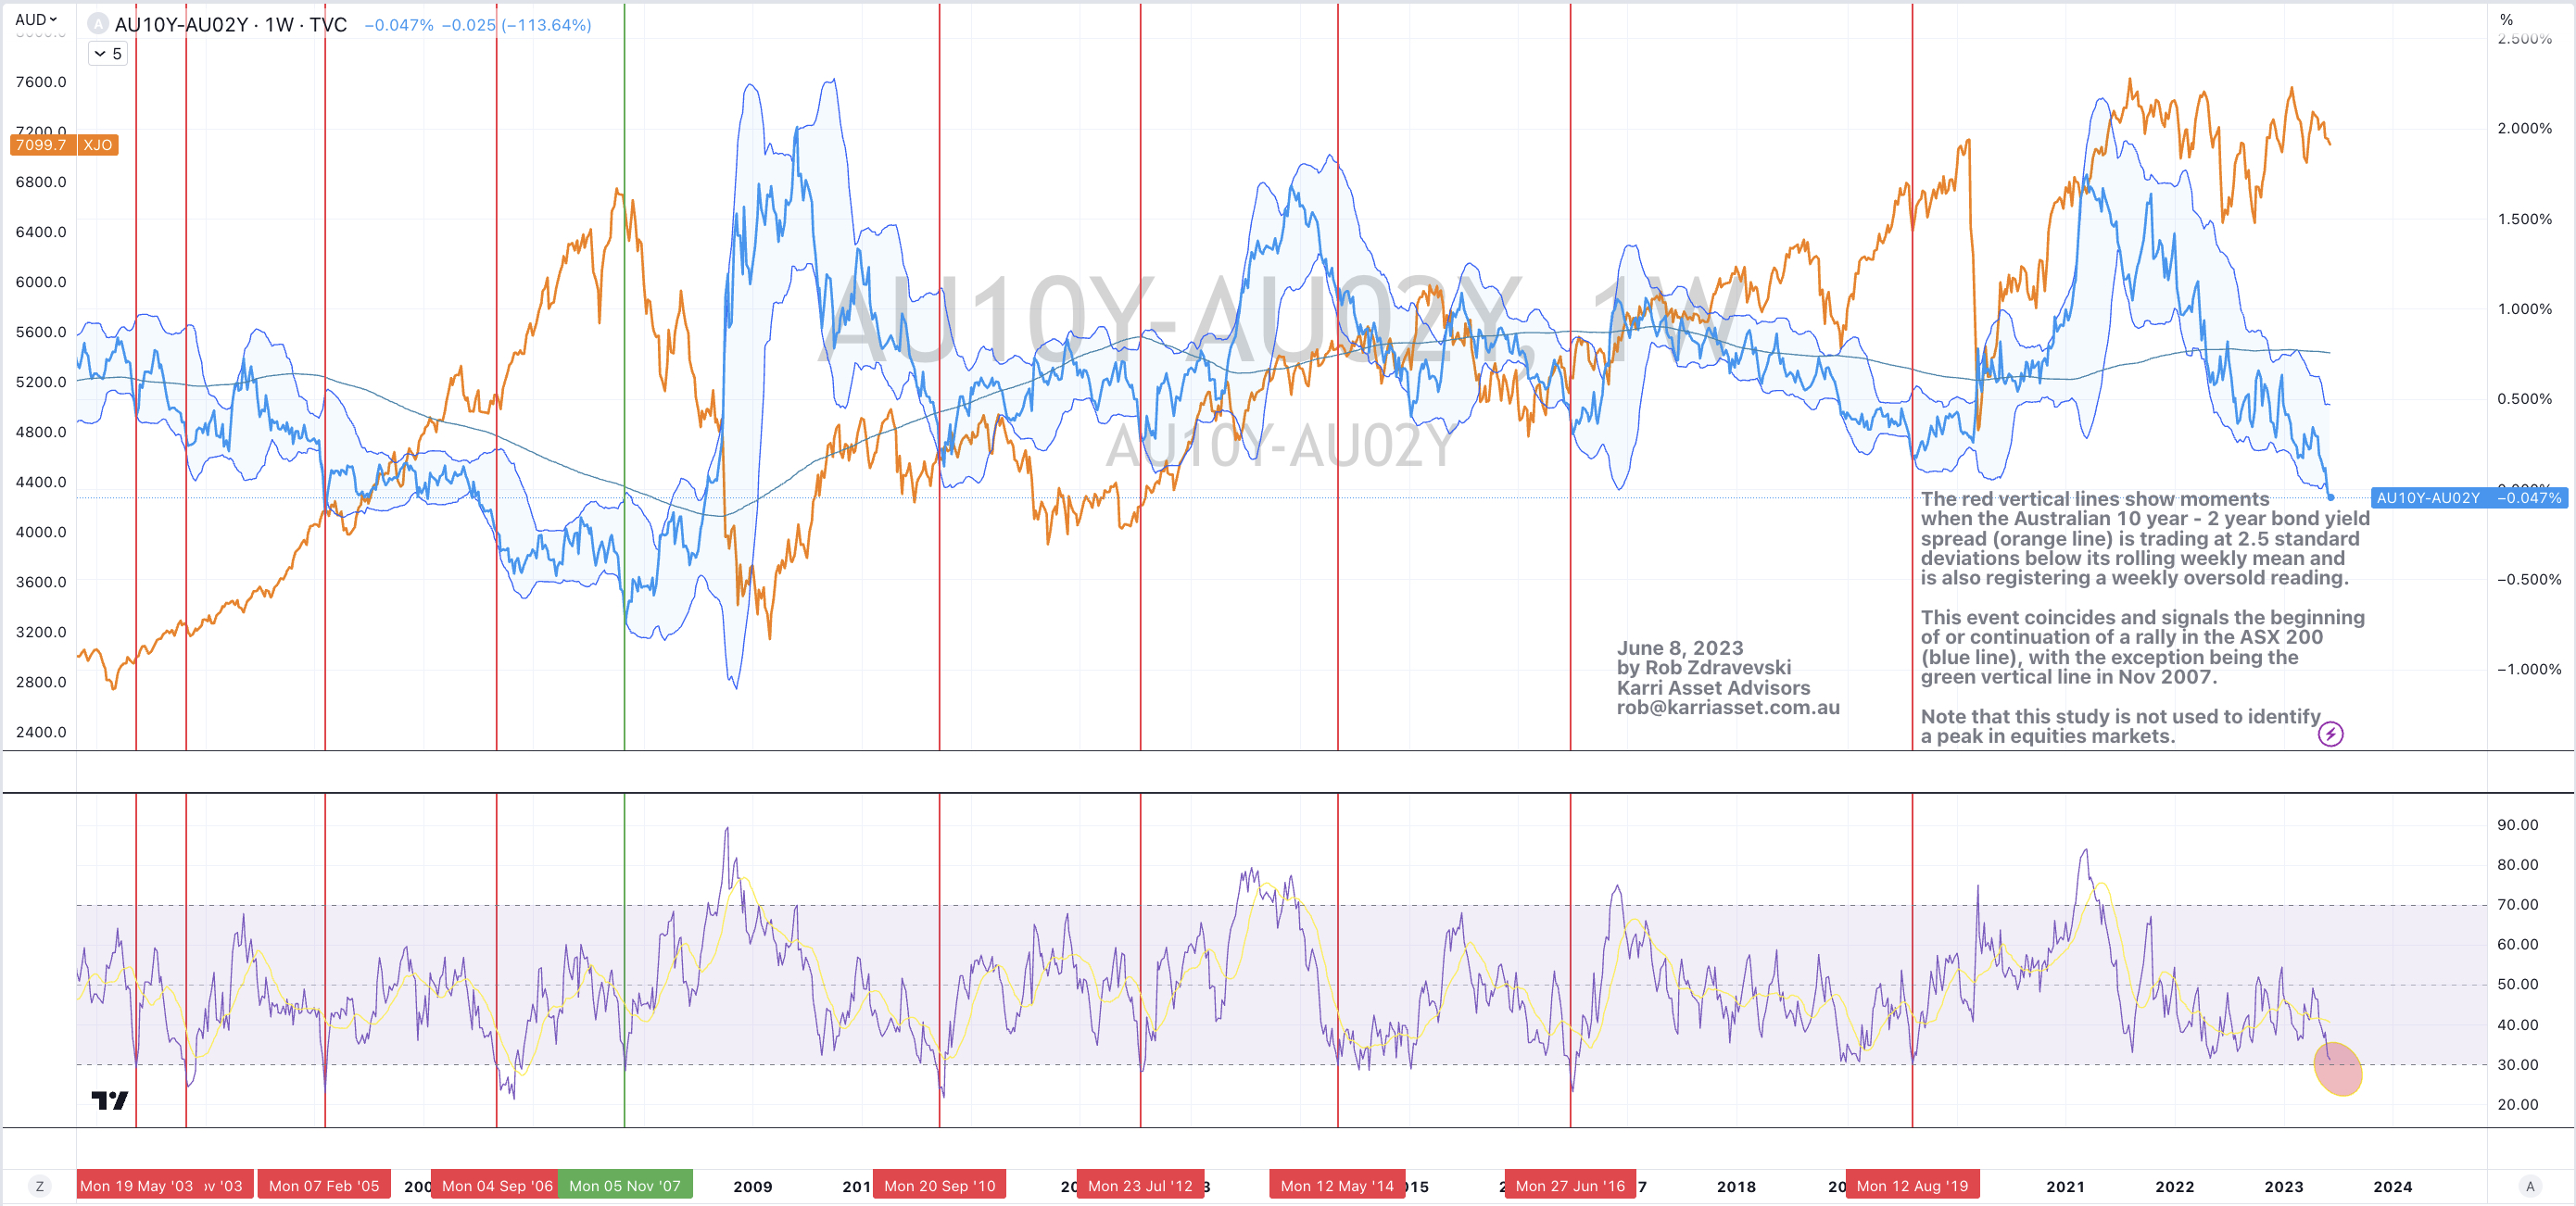
The red vertical lines show moments when the Australian 10 year – 2 year bond yield spread (orange line) is trading at 2.5 standard deviations below its rolling weekly mean and is also registering a weekly oversold reading.
This event coincides and signals the beginning of or continuation of a rally in the ASX 200 (blue line), with the exception being the green vertical line in Nov 2007.
Note that this study is not used to identify a peak in equities markets.
It’s important to note this observation is around the continuation or extension of a rally and not a signal of a major trough where one would ‘pile-in’.
Not all rallies and bull markets smell the same.
June 8, 2023
by Rob Zdravevski
rob@karriasset.com.au